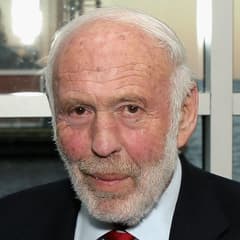
Jim Simons Renaissance Technologies
Jim Simons is the founder of Renaissance Technologies, one of the most successful quantitative hedge funds in the world. Before his career in finance, he served as a mathematics professor and made significant contributions to differential geometry. Simons applied his analytical expertise to develop sophisticated, algorithm-driven trading strategies, earning consistently high returns for investors.
Top-Käufe
| Rang | Aktie | Wert |
|---|---|---|
| 1 |

Microsoft
MSFT
|
+1,04 Mrd. $ |
| 2 |

Chevron
CVX
|
+820 Mio. $ |
| 3 |

Shopify
SHOP
|
+599 Mio. $ |
| 4 |

Berkshire Hathaway Class B
BRK.B
|
+539 Mio. $ |
| 5 |

Meta Platforms (Facebook)
META
|
+479 Mio. $ |
Größte Verkäufe
| Rang | Aktie | Wert |
|---|---|---|
| 1 |

Amazon
AMZN
|
+675 Mio. $ |
| 2 |

Tesla
TSLA
|
+661 Mio. $ |
| 3 |

Alphabet (Google) Class A
GOOGL
|
+633 Mio. $ |
| 4 |

Verizon
VZ
|
+533 Mio. $ |
| 5 |

Alphabet (Google) Class C
GOOG
|
+377 Mio. $ |
Sektoraufteilung
| Rang | Sektor | Gewichtung |
|---|---|---|
| 1 | Gesundheitswesen | 19,47 % |
| 2 | Technologie | 16,83 % |
| 3 | Basiskonsumgüter | 11,12 % |
| 4 | Nicht-Basiskonsumgüter | 10,18 % |
| 5 | Finanzwesen | 8,89 % |
| Name | Marktwert | Portfolioanteil | Aktien oder Kapitalbetrag |
Änderung der Beteiligung | Kapitalfluss | Im Bestand seit | |
|---|---|---|---|---|---|---|---|

1
Novo Nordisk
NVO
182 Mrd. $
| 1,95 Mrd. $ | 2,31 % |
35.059.342
-1.708.600
| -5 % | -94,8 Mio. $ |
2013 Q2
36 Quartale
|
|
|
2
Microsoft
MSFT
4,05 Bio. $
| 981 Mio. $ | 1,16 % |
+3.820.133
| Neu | +1,04 Mrd. $ |
2022 Q2
0 Quartale
|
|
|
3
Meta Platforms (Facebook)
META
1,64 Bio. $
| 884 Mio. $ | 1,05 % |
5.485.159
+2.484.159
| +83 % | +479 Mio. $ |
2021 Q3
3 Quartale
|
|

4
Apple
AAPL
5,1 Bio. $
| 845 Mio. $ | 1 % |
6.179.661
+1.675.469
| +37 % | +254 Mio. $ |
2020 Q3
7 Quartale
|
|
|
5
Chevron
CVX
411 Mrd. $
| 838 Mio. $ | 0,99 % |
5.786.295
+4.960.475
| +601 % | +820 Mio. $ |
2020 Q2
8 Quartale
|
|

6
Gilead Sciences
GILD
210 Mrd. $
| 829 Mio. $ | 0,98 % |
13.409.616
-2.082.500
| -13 % | -129 Mio. $ |
2014 Q4
30 Quartale
|
|

7
Kroger
KR
40,2 Mrd. $
| 793 Mio. $ | 0,94 % |
16.746.010
+318.500
| +2 % | +17 Mio. $ |
2019 Q2
12 Quartale
|
|

8
Hershey
HSY
34,9 Mrd. $
| 790 Mio. $ | 0,94 % |
3.671.367
+611.100
| +20 % | +133 Mio. $ |
2013 Q2
36 Quartale
|
|

9
Zoom
ZM
26,8 Mrd. $
| 694 Mio. $ | 0,82 % |
6.429.004
-20.302
| -0,3 % | -2,14 Mio. $ |
2020 Q1
9 Quartale
|
|

10
VeriSign
VRSN
27,4 Mrd. $
| 662 Mio. $ | 0,78 % |
3.956.890
-59.700
| -1 % | -11 Mio. $ |
2013 Q2
36 Quartale
|
|

11
United Therapeutics
UTHR
24,8 Mrd. $
| 658 Mio. $ | 0,78 % |
2.793.591
+28.378
| +1 % | +5,77 Mio. $ |
2013 Q2
36 Quartale
|
|

12
Merck
MRK
367 Mrd. $
| 617 Mio. $ | 0,73 % |
6.763.934
+1.664.600
| +33 % | +148 Mio. $ |
2019 Q2
12 Quartale
|
|

13
ExxonMobil
XOM
672 Mrd. $
| 613 Mio. $ | 0,73 % |
7.156.786
+712.022
| +11 % | +64,2 Mio. $ |
2021 Q1
5 Quartale
|
|

14
Franco-Nevada
FNV
50,8 Mrd. $
| 567 Mio. $ | 0,67 % |
4.310.103
+236.600
| +6 % | +35 Mio. $ |
2014 Q1
33 Quartale
|
|

15
Monster Beverage
MNST
89,3 Mrd. $
| 524 Mio. $ | 0,62 % |
22.620.240
-5.492.000
| -20 % | -119 Mio. $ |
2014 Q1
33 Quartale
|
|
|
16
Tesla
TSLA
1,49 Bio. $
| 504 Mio. $ | 0,6 % |
2.245.425
-2.420.700
| -52 % | -661 Mio. $ |
2018 Q4
14 Quartale
|
|

17
Airbnb
ABNB
112 Mrd. $
| 499 Mio. $ | 0,59 % |
5.604.567
+2.200.800
| +65 % | +286 Mio. $ |
2021 Q2
4 Quartale
|
|

18
Vertex Pharmaceuticals
VRTX
140 Mrd. $
| 496 Mio. $ | 0,59 % |
1.761.168
+53.800
| +3 % | +14,4 Mio. $ |
2017 Q1
21 Quartale
|
|
|
19
Berkshire Hathaway Class B
BRK.B
1,22 Bio. $
| 489 Mio. $ | 0,58 % |
1.791.000
+1.718.500
| +2.370 % | +539 Mio. $ |
2020 Q4
6 Quartale
|
|

20
Molina Healthcare
MOH
10,6 Mrd. $
| 481 Mio. $ | 0,57 % |
1.719.715
-93.900
| -5 % | -28,4 Mio. $ |
2013 Q2
36 Quartale
|
|

21
Home Depot
HD
353 Mrd. $
| 480 Mio. $ | 0,57 % |
1.750.900
-131.719
| -7 % | -38,9 Mio. $ |
2022 Q1
1 Quartal
|
|

22
Abbott
ABT
191 Mrd. $
| 458 Mio. $ | 0,54 % |
4.216.503
+1.075.637
| +34 % | +122 Mio. $ |
2021 Q3
3 Quartale
|
|

23
Atlassian
TEAM
39,2 Mrd. $
| 458 Mio. $ | 0,54 % |
2.443.620
-200.300
| -8 % | -42,8 Mio. $ |
2016 Q2
24 Quartale
|
|

24
PepsiCo
PEP
193 Mrd. $
| 454 Mio. $ | 0,54 % |
2.727.014
+768.371
| +39 % | +129 Mio. $ |
2021 Q1
5 Quartale
|
|

25
JPMorgan Chase
JPM
908 Mrd. $
| 443 Mio. $ | 0,52 % |
3.931.843
+2.791.457
| +245 % | +346 Mio. $ |
2021 Q2
4 Quartale
|
|
Ähnliche Fonds







Portfolio-Rückblick von Jim Simons für Q2 2022
Zum Stand von Q2 2022 hielt Jim Simons 4.738 Positionen im Wert von 84,5 Mrd. $, ein Rückgang um 0,87 % gegenüber 85,2 Mrd. $ im Vorquartal. Die zehn größten Positionen machen 11 % des Portfolios aus.
Jim Simons investierte 13,7 Mrd. $ an neuem Nettokapital in Q2 2022, eröffnete 693 neue Positionen und stockte 1.955 bestehende Positionen auf. Seine größte neue Position war Microsoft: 3.820.133 Aktien im Wert von 981 Mio. $.
Nach Sektoren betrachtet ist das Portfolio mit 19 % des verwalteten Vermögens am stärksten in Gesundheitswesen gewichtet, gegenüber 19 % im Vorquartal. Es folgen Technologie und Basiskonsumgüter.
Die größte Reduzierung auf der Verkaufsseite betraf Tesla; sie wurde auf 661 Mio. $ geschätzt.
- Der größte Kauf von Jim Simons im Q2 2022 war Microsoft: 3.820.133 Aktien im Wert von 981 Mio. $.
- Jim Simons hat seine Position in Chevron in Q2 2022 am stärksten aufgestockt – der geschätzte Zuwachs beträgt 820 Mio. $.
- Der größte Positionsabbau von Jim Simons im Q2 2022 entfiel auf Tesla und belief sich schätzungsweise auf 661 Mio. $.
- Jim Simons hat seine Position in Amazon im Q2 2022 vollständig aufgelöst und dabei schätzungsweise 675 Mio. $ verkauft.
- Die zehn größten Positionen von Jim Simons machen im Q2 2022 11 % des Portfolios mit einem verwalteten Vermögen von 84,5 Mrd. $ aus.
- Jim Simons eröffnete 693 neue Positionen und schloss 562 Positionen im Q2 2022.
- Der Portfoliowert von Jim Simons sank gegenüber dem Vorquartal um 0,87 % auf 84,5 Mrd. $.
Auf Grundlage der von Renaissance Technologies für Q2 2022 am 12. Aug. 2022 eingereichten 13F-Meldung .