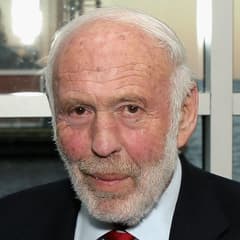
Jim Simons Renaissance Technologies
Jim Simons is the founder of Renaissance Technologies, one of the most successful quantitative hedge funds in the world. Before his career in finance, he served as a mathematics professor and made significant contributions to differential geometry. Simons applied his analytical expertise to develop sophisticated, algorithm-driven trading strategies, earning consistently high returns for investors.
Top-Käufe
| Rang | Aktie | Wert |
|---|---|---|
| 1 |

Apple
AAPL
|
+510 Mio. $ |
| 2 |

Pfizer
PFE
|
+265 Mio. $ |
| 3 |

Gilead Sciences
GILD
|
+212 Mio. $ |
| 4 |

Comcast
CMCSA
|
+191 Mio. $ |
| 5 |

Meta Platforms (Facebook)
META
|
+184 Mio. $ |
Größte Verkäufe
| Rang | Aktie | Wert |
|---|---|---|
| 1 |

Alphabet (Google) Class C
GOOG
|
+369 Mio. $ |
| 2 |
SIAL
SIGMA - ALDRICH CORP
SIAL
|
+330 Mio. $ |
| 3 |
MJN
Mead Johnson Nutrition Company
MJN
|
+230 Mio. $ |
| 4 |

Amgen
AMGN
|
+223 Mio. $ |
| 5 |

Teva Pharmaceutical Industries Limited
TEVA
|
+145 Mio. $ |
Sektoraufteilung
| Rang | Sektor | Gewichtung |
|---|---|---|
| 1 | Technologie | 15,78 % |
| 2 | Gesundheitswesen | 13,71 % |
| 3 | Finanzwesen | 10,83 % |
| 4 | Industrie | 9,89 % |
| 5 | Basiskonsumgüter | 9,61 % |
| Name | Marktwert | Portfolioanteil | Aktien oder Kapitalbetrag |
Änderung der Beteiligung | Kapitalfluss | Im Bestand seit | |
|---|---|---|---|---|---|---|---|

1
Novo Nordisk
NVO
179 Mrd. $
| 749 Mio. $ | 1,63 % |
25.797.600
-544.400
| -2 % | -15,1 Mio. $ |
2013 Q2
10 Quartale
|
|

2
Colgate-Palmolive
CL
78 Mrd. $
| 670 Mio. $ | 1,46 % |
10.062.900
-1.374.800
| -12 % | -91,5 Mio. $ |
2013 Q2
10 Quartale
|
|
|
3
Apple
AAPL
5,06 Bio. $
| 470 Mio. $ | 1,02 % |
+17.852.932
| Neu | +510 Mio. $ |
2015 Q4
0 Quartale
|
|

4
VeriSign
VRSN
27,9 Mrd. $
| 426 Mio. $ | 0,93 % |
4.876.476
-137.600
| -3 % | -11,5 Mio. $ |
2013 Q2
10 Quartale
|
|

5
Alaska Air
ALK
4,68 Mrd. $
| 386 Mio. $ | 0,84 % |
4.799.500
-715.221
| -13 % | -56,6 Mio. $ |
2013 Q2
10 Quartale
|
|

6
NetEase
NTES
82 Mrd. $
| 362 Mio. $ | 0,79 % |
9.980.500
-2.946.000
| -23 % | -91,7 Mio. $ |
2013 Q2
10 Quartale
|
|
|
LLTC
7
Nicht mehr gelistet
Linear Technology Corp
LLTC
| 326 Mio. $ | 0,71 % |
7.681.200
+19.000
| +0,2 % | +835.326 $ |
2013 Q2
10 Quartale
|
|

8
Ryanair
RYAAY
31,7 Mrd. $
| 308 Mio. $ | 0,67 % |
8.911.798
+773.887
| +10 % | +25,3 Mio. $ |
2013 Q2
10 Quartale
|
|

9
Mastercard
MA
574 Mrd. $
| 294 Mio. $ | 0,64 % |
3.021.400
+205.800
| +7 % | +20,2 Mio. $ |
2013 Q2
10 Quartale
|
|

10
Domino's
DPZ
10,9 Mrd. $
| 294 Mio. $ | 0,64 % |
2.639.900
-180.500
| -6 % | -19,3 Mio. $ |
2013 Q2
10 Quartale
|
|

11
Cboe Global Markets
CBOE
38,1 Mrd. $
| 286 Mio. $ | 0,62 % |
4.399.700
+176.000
| +4 % | +11,9 Mio. $ |
2013 Q2
10 Quartale
|
|

12
Novartis
NVS
308 Mrd. $
| 266 Mio. $ | 0,58 % |
3.449.777
+1.572.221
| +84 % | +125 Mio. $ |
2013 Q3
9 Quartale
|
|
|
13
Pfizer
PFE
167 Mrd. $
| 258 Mio. $ | 0,56 % |
+8.416.549
| Neu | +265 Mio. $ |
2015 Q4
0 Quartale
|
|

14
Palo Alto Networks
PANW
267 Mrd. $
| 239 Mio. $ | 0,52 % |
8.142.000
+4.361.400
| +115 % | +126 Mio. $ |
2015 Q2
2 Quartale
|
|
|
15
Gilead Sciences
GILD
212 Mrd. $
| 235 Mio. $ | 0,51 % |
2.319.448
+2.039.148
| +727 % | +212 Mio. $ |
2014 Q4
4 Quartale
|
|

16
Duke Energy
DUK
101 Mrd. $
| 229 Mio. $ | 0,5 % |
3.208.267
+143.800
| +5 % | +10,1 Mio. $ |
2014 Q1
7 Quartale
|
|

17
Coca-Cola
KO
417 Mrd. $
| 217 Mio. $ | 0,47 % |
5.049.399
+1.753.300
| +53 % | +74,4 Mio. $ |
2014 Q3
5 Quartale
|
|

18
Allegiant Air
ALGT
2,59 Mrd. $
| 212 Mio. $ | 0,46 % |
1.263.100
+11.900
| +1 % | +2,29 Mio. $ |
2013 Q2
10 Quartale
|
|

19
Nicht mehr gelistet
AvalonBay Communities
AVB
| 210 Mio. $ | 0,46 % |
1.138.514
+278.100
| +32 % | +49,8 Mio. $ |
2014 Q3
5 Quartale
|
|
|
BCR
20
Nicht mehr gelistet
CR Bard Inc.
BCR
| 208 Mio. $ | 0,45 % |
1.098.500
+207.600
| +23 % | +38,9 Mio. $ |
2013 Q2
10 Quartale
|
|

21
Hershey
HSY
35 Mrd. $
| 198 Mio. $ | 0,43 % |
2.216.300
-299.100
| -12 % | -26,8 Mio. $ |
2013 Q2
10 Quartale
|
|

22
Barrick Mining
B
65,3 Mrd. $
| 190 Mio. $ | 0,41 % |
25.706.526
+7.613.624
| +42 % | +56,8 Mio. $ |
2014 Q2
6 Quartale
|
|

23
Huntington Ingalls Industries
HII
12,4 Mrd. $
| 189 Mio. $ | 0,41 % |
1.488.700
+14.800
| +1 % | +1,81 Mio. $ |
2013 Q2
10 Quartale
|
|
|
24
Meta Platforms (Facebook)
META
1,64 Bio. $
| 188 Mio. $ | 0,41 % |
+1.792.200
| Neu | +184 Mio. $ |
2015 Q4
0 Quartale
|
|

25
Clorox
CLX
12,9 Mrd. $
| 187 Mio. $ | 0,41 % |
1.473.800
-355.100
| -19 % | -44,1 Mio. $ |
2013 Q2
10 Quartale
|
|
Ähnliche Fonds





Portfolio-Rückblick von Jim Simons für Q4 2015
Zum Stand von Q4 2015 hielt Jim Simons 3.639 Positionen im Wert von 45,9 Mrd. $, ein Anstieg um 9,5 % gegenüber 41,9 Mrd. $ im Vorquartal. Die zehn größten Positionen machen 9,3 % des Portfolios aus.
Jim Simons investierte 3,07 Mrd. $ an neuem Nettokapital in Q4 2015, eröffnete 509 neue Positionen und stockte 1.872 bestehende Positionen auf. Seine größte neue Position war Apple: 17.852.932 Aktien im Wert von 470 Mio. $.
Nach Sektoren betrachtet ist das Portfolio mit 16 % des verwalteten Vermögens am stärksten in Technologie gewichtet, gegenüber 12 % im Vorquartal. Es folgen Gesundheitswesen und Finanzwesen.
Die größte Reduzierung auf der Verkaufsseite betraf Alphabet (Google) Class C; sie wurde auf 369 Mio. $ geschätzt.
- Der größte Kauf von Jim Simons im Q4 2015 war Apple: 17.852.932 Aktien im Wert von 470 Mio. $.
- Jim Simons hat seine Position in Gilead Sciences in Q4 2015 am stärksten aufgestockt – der geschätzte Zuwachs beträgt 212 Mio. $.
- Der größte Positionsabbau von Jim Simons im Q4 2015 entfiel auf Alphabet (Google) Class C und belief sich schätzungsweise auf 369 Mio. $.
- Jim Simons hat seine Position in SIGMA - ALDRICH CORP im Q4 2015 vollständig aufgelöst und dabei schätzungsweise 330 Mio. $ verkauft.
- Die zehn größten Positionen von Jim Simons machen im Q4 2015 9,3 % des Portfolios mit einem verwalteten Vermögen von 45,9 Mrd. $ aus.
- Jim Simons eröffnete 509 neue Positionen und schloss 385 Positionen im Q4 2015.
- Der Portfoliowert von Jim Simons stieg gegenüber dem Vorquartal um 9,5 % auf 45,9 Mrd. $.
Auf Grundlage der von Renaissance Technologies für Q4 2015 am 11. Feb. 2016 eingereichten 13F-Meldung .