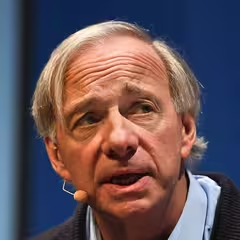
Ray Dalio Bridgewater Associates
Ray Dalio is the founder of Bridgewater Associates, one of the world’s largest hedge funds, known for its unique “principles-based” culture and systematic investment approach. Dalio’s investment philosophy emphasizes diversified portfolios, risk parity, and the importance of understanding economic cycles in shaping investment decisions. He has authored several books, including “Principles: Life & Work,” in which he details his management philosophies, personal experiences, and life lessons.
Top-Käufe
| Rang | Aktie | Wert |
|---|---|---|
| 1 |

State Street SPDR S&P 500 ETF Trust
SPY
|
+693 Mio. $ |
| 2 |

iShares Core S&P 500 ETF
IVV
|
+235 Mio. $ |
| 3 |

Vanguard S&P 500 ETF
VOO
|
+200 Mio. $ |
| 4 |

Petrobras
PBR
|
+105 Mio. $ |
| 5 |

Shell
SHEL
|
+105 Mio. $ |
Größte Verkäufe
| Rang | Aktie | Wert |
|---|---|---|
| 1 |

Micron Technology
MU
|
+1,02 Mrd. $ |
| 2 |

Amazon
AMZN
|
+593 Mio. $ |
| 3 |

TSMC
TSM
|
+423 Mio. $ |
| 4 |

Marvell Technology
MRVL
|
+354 Mio. $ |
| 5 |

GE Vernova
GEV
|
+319 Mio. $ |
Sektoraufteilung
| Rang | Sektor | Gewichtung |
|---|---|---|
| 1 | Sonstiges | 30,62 % |
| 2 | Technologie | 21,23 % |
| 3 | Industrie | 7,72 % |
| 4 | Finanzwesen | 6,76 % |
| 5 | Gesundheitswesen | 6,62 % |
| Name | Marktwert | Portfolioanteil | Aktien oder Kapitalbetrag |
Änderung der Beteiligung | Kapitalfluss | Im Bestand seit | |
|---|---|---|---|---|---|---|---|

476
Viking Holdings
VIK
39 Mrd. $
| 5,28 Mio. $ | 0,02 % |
50.400
-54.785
| -52 % | -4,74 Mio. $ |
2025 Q3
3 Quartale
|
|

477
Emerson Electric
EMR
89,5 Mrd. $
| 5,23 Mio. $ | 0,02 % |
36.541
-97.432
| -73 % | -13,7 Mio. $ |
2026 Q1
1 Quartal
|
|

478
Aon
AON
62,9 Mrd. $
| 5,2 Mio. $ | 0,02 % |
15.663
-4.556
| -23 % | -1,47 Mio. $ |
2025 Q3
3 Quartale
|
|

479
Raymond James Financial
RJF
29,9 Mrd. $
| 5,18 Mio. $ | 0,02 % |
34.074
+4.260
| +14 % | +646.673 $ |
2025 Q3
3 Quartale
|
|

480
Pegasystems
PEGA
5,96 Mrd. $
| 5,07 Mio. $ | 0,02 % |
169.146
-7.557
| -4 % | -270.359 $ |
2025 Q2
4 Quartale
|
|

481
IQVIA
IQV
44,1 Mrd. $
| 5,06 Mio. $ | 0,02 % |
26.210
-20.909
| -44 % | -3,65 Mio. $ |
2025 Q4
2 Quartale
|
|

482
Corcept Therapeutics
CORT
12,6 Mrd. $
| 5,01 Mio. $ | 0,02 % |
57.602
+19.180
| +50 % | +1,16 Mio. $ |
2025 Q3
3 Quartale
|
|

483
Flywire
FLYW
2,3 Mrd. $
| 5 Mio. $ | 0,02 % |
+284.851
| Neu | +4,21 Mio. $ |
2026 Q2
0 Quartale
|
|

484
Dana Inc
DAN
3,14 Mrd. $
| 5 Mio. $ | 0,02 % |
183.764
+157.464
| +599 % | +5,37 Mio. $ |
2026 Q1
1 Quartal
|
|

485
RTX Corp
RTX
261 Mrd. $
| 4,97 Mio. $ | 0,02 % |
+26.182
| Neu | +4,8 Mio. $ |
2026 Q2
0 Quartale
|
|

486
Henry Schein
HSIC
9,44 Mrd. $
| 4,93 Mio. $ | 0,02 % |
58.993
+26.895
| +84 % | +2,06 Mio. $ |
2020 Q1
25 Quartale
|
|

487
BioCryst Pharmaceuticals
BCRX
2,03 Mrd. $
| 4,91 Mio. $ | 0,02 % |
491.057
-146.997
| -23 % | -1,33 Mio. $ |
2025 Q3
3 Quartale
|
|

488
Broadridge
BR
20,3 Mrd. $
| 4,9 Mio. $ | 0,02 % |
+35.752
| Neu | +5,4 Mio. $ |
2026 Q2
0 Quartale
|
|

489
Danaher
DHR
158 Mrd. $
| 4,89 Mio. $ | 0,02 % |
25.684
+335
| +1 % | +60.825 $ |
2025 Q4
2 Quartale
|
|

490
Intercontinental Exchange
ICE
89 Mrd. $
| 4,79 Mio. $ | 0,02 % |
+38.886
| Neu | +5,84 Mio. $ |
2026 Q2
0 Quartale
|
|

491
Watts Water Technologies
WTS
12 Mrd. $
| 4,79 Mio. $ | 0,02 % |
12.227
+1.484
| +14 % | +462.821 $ |
2025 Q3
3 Quartale
|
|

492
Walt Disney
DIS
193 Mrd. $
| 4,75 Mio. $ | 0,02 % |
49.331
+25.471
| +107 % | +2,6 Mio. $ |
2026 Q1
1 Quartal
|
|

493
Warrior Met Coal
HCC
4,44 Mrd. $
| 4,74 Mio. $ | 0,02 % |
58.463
+6.939
| +13 % | +627.381 $ |
2024 Q2
8 Quartale
|
|

494
Textron
TXT
13,3 Mrd. $
| 4,63 Mio. $ | 0,02 % |
50.477
+46.372
| +1.130 % | +4,21 Mio. $ |
2025 Q3
3 Quartale
|
|

495
Builders FirstSource
BLDR
5,8 Mrd. $
| 4,59 Mio. $ | 0,02 % |
51.283
+47.221
| +1.163 % | +3,77 Mio. $ |
2026 Q1
1 Quartal
|
|

496
CNO Financial Group
CNO
5,08 Mrd. $
| 4,54 Mio. $ | 0,02 % |
89.137
-99.648
| -53 % | -4,63 Mio. $ |
2021 Q4
18 Quartale
|
|

497
Intel
INTC
485 Mrd. $
| 4,52 Mio. $ | 0,02 % |
+32.371
| Neu | +3,27 Mio. $ |
2026 Q2
0 Quartale
|
|

498
Blackrock
BLK
175 Mrd. $
| 4,5 Mio. $ | 0,02 % |
+4.683
| Neu | +4,84 Mio. $ |
2026 Q2
0 Quartale
|
|

499
Haemonetics
HAE
5,38 Mrd. $
| 4,48 Mio. $ | 0,02 % |
59.733
+11.356
| +23 % | +729.486 $ |
2026 Q1
1 Quartal
|
|

500
TXNM Energy Inc
TXNM
6,44 Mrd. $
| 4,44 Mio. $ | 0,02 % |
78.109
+3.190
| +4 % | +187.103 $ |
2026 Q1
1 Quartal
|
|
Ähnliche Fonds








Portfolio-Rückblick von Ray Dalio für Q2 2026
Zum Stand von Q2 2026 hielt Ray Dalio 1.206 Positionen im Wert von 24,4 Mrd. $, ein Anstieg um 8,8 % gegenüber 22,4 Mrd. $ im Vorquartal. Die zehn größten Positionen machen 40 % des Portfolios aus.
Ray Dalio zog im Q2 2026 netto 3,05 Mrd. $ ab, schloss 209 Positionen und reduzierte 379 Bestände. Der bemerkenswerteste Ausstieg war Cisco – eine Position im geschätzten Wert von 63,8 Mio. $, die vollständig verkauft wurde.
Nach Sektoren betrachtet ist das Portfolio mit 31 % des verwalteten Vermögens am stärksten in Sonstiges gewichtet, gegenüber 25 % im Vorquartal. Es folgen Technologie und Industrie.
Entgegen dem Trend eröffnete Ray Dalio eine neue Position in Eversource Energy im Wert von 86,4 Mio. $.
- Der größte Kauf von Ray Dalio im Q2 2026 war Eversource Energy: 1.195.140 Aktien im Wert von 86,4 Mio. $.
- Ray Dalio hat seine Position in State Street SPDR S&P 500 ETF Trust in Q2 2026 am stärksten aufgestockt – der geschätzte Zuwachs beträgt 693 Mio. $.
- Der größte Positionsabbau von Ray Dalio im Q2 2026 entfiel auf Micron Technology und belief sich schätzungsweise auf 1,02 Mrd. $.
- Ray Dalio hat seine Position in Cisco im Q2 2026 vollständig aufgelöst und dabei schätzungsweise 63,8 Mio. $ verkauft.
- Die zehn größten Positionen von Ray Dalio machen im Q2 2026 40 % des Portfolios mit einem verwalteten Vermögen von 24,4 Mrd. $ aus.
- Ray Dalio eröffnete 213 neue Positionen und schloss 209 Positionen im Q2 2026.
- Der Portfoliowert von Ray Dalio stieg gegenüber dem Vorquartal um 8,8 % auf 24,4 Mrd. $.
Auf Grundlage der von Bridgewater Associates für Q2 2026 am 14. Aug. 2026 eingereichten 13F-Meldung .