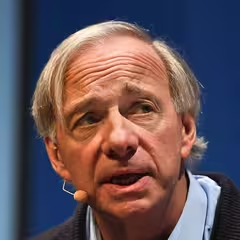
Ray Dalio Bridgewater Associates
Ray Dalio is the founder of Bridgewater Associates, one of the world’s largest hedge funds, known for its unique “principles-based” culture and systematic investment approach. Dalio’s investment philosophy emphasizes diversified portfolios, risk parity, and the importance of understanding economic cycles in shaping investment decisions. He has authored several books, including “Principles: Life & Work,” in which he details his management philosophies, personal experiences, and life lessons.
Top-Käufe
| Rang | Aktie | Wert |
|---|---|---|
| 1 |

State Street SPDR S&P 500 ETF Trust
SPY
|
+693 Mio. $ |
| 2 |

iShares Core S&P 500 ETF
IVV
|
+235 Mio. $ |
| 3 |

Vanguard S&P 500 ETF
VOO
|
+200 Mio. $ |
| 4 |

Petrobras
PBR
|
+105 Mio. $ |
| 5 |

Shell
SHEL
|
+105 Mio. $ |
Größte Verkäufe
| Rang | Aktie | Wert |
|---|---|---|
| 1 |

Micron Technology
MU
|
+1,02 Mrd. $ |
| 2 |

Amazon
AMZN
|
+593 Mio. $ |
| 3 |

TSMC
TSM
|
+423 Mio. $ |
| 4 |

Marvell Technology
MRVL
|
+354 Mio. $ |
| 5 |

GE Vernova
GEV
|
+319 Mio. $ |
Sektoraufteilung
| Rang | Sektor | Gewichtung |
|---|---|---|
| 1 | Sonstiges | 30,62 % |
| 2 | Technologie | 21,23 % |
| 3 | Industrie | 7,72 % |
| 4 | Finanzwesen | 6,76 % |
| 5 | Gesundheitswesen | 6,62 % |
| Name | Marktwert | Portfolioanteil | Aktien oder Kapitalbetrag |
Änderung der Beteiligung | Kapitalfluss | Im Bestand seit | |
|---|---|---|---|---|---|---|---|

451
Constellation Energy
CEG
92 Mrd. $
| 5,74 Mio. $ | 0,02 % |
23.123
-183.216
| -89 % | -51,6 Mio. $ |
2025 Q4
2 Quartale
|
|

452
Karman Holdings
KRMN
4,73 Mrd. $
| 5,71 Mio. $ | 0,02 % |
114.290
+84.639
| +285 % | +5,47 Mio. $ |
2026 Q1
1 Quartal
|
|

453
Voya Financial
VOYA
8,68 Mrd. $
| 5,69 Mio. $ | 0,02 % |
62.829
-25.657
| -29 % | -2,09 Mio. $ |
2024 Q2
8 Quartale
|
|

454
Lincoln National
LNC
7,59 Mrd. $
| 5,66 Mio. $ | 0,02 % |
160.168
-65.171
| -29 % | -2,34 Mio. $ |
2024 Q2
8 Quartale
|
|

455
ADT
ADT
4,97 Mrd. $
| 5,65 Mio. $ | 0,02 % |
869.859
-683.900
| -44 % | -4,69 Mio. $ |
2024 Q2
8 Quartale
|
|

456
Amer Sports
AS
17,7 Mrd. $
| 5,65 Mio. $ | 0,02 % |
166.942
-133.781
| -44 % | -4,69 Mio. $ |
2025 Q3
3 Quartale
|
|

457
Hess Midstream
HESM
3,94 Mrd. $
| 5,64 Mio. $ | 0,02 % |
149.973
+103.769
| +225 % | +3,99 Mio. $ |
2025 Q3
3 Quartale
|
|

458
Flex
FLEX
32,4 Mrd. $
| 5,57 Mio. $ | 0,02 % |
34.390
-21.710
| -39 % | -2,63 Mio. $ |
2023 Q1
13 Quartale
|
|

459
CBRE Group
CBRE
39 Mrd. $
| 5,57 Mio. $ | 0,02 % |
+41.377
| Neu | +5,7 Mio. $ |
2026 Q2
0 Quartale
|
|

460
Vontier
VNT
4,58 Mrd. $
| 5,53 Mio. $ | 0,02 % |
190.533
+98.469
| +107 % | +3,15 Mio. $ |
2025 Q2
4 Quartale
|
|

461
ON Semiconductor
ON
29,6 Mrd. $
| 5,52 Mio. $ | 0,02 % |
58.377
+38.359
| +192 % | +3,93 Mio. $ |
2025 Q4
2 Quartale
|
|

462
Cintas
CTAS
85,4 Mrd. $
| 5,5 Mio. $ | 0,02 % |
32.363
+20.897
| +182 % | +3,61 Mio. $ |
2026 Q1
1 Quartal
|
|

463
Idaho Strategic Resources
IDR
339 Mio. $
| 5,5 Mio. $ | 0,02 % |
167.828
-32.021
| -16 % | -1,24 Mio. $ |
2025 Q4
2 Quartale
|
|

464
Veeva Systems
VEEV
51,2 Mrd. $
| 5,45 Mio. $ | 0,02 % |
+30.709
| Neu | +5,06 Mio. $ |
2026 Q2
0 Quartale
|
|

465
Abbott
ABT
178 Mrd. $
| 5,42 Mio. $ | 0,02 % |
59.775
-57.276
| -49 % | -5,23 Mio. $ |
2020 Q3
23 Quartale
|
|

466
Masco
MAS
14,7 Mrd. $
| 5,4 Mio. $ | 0,02 % |
66.385
+41.435
| +166 % | +2,89 Mio. $ |
2026 Q1
1 Quartal
|
|

467
Celanese
CE
5,2 Mrd. $
| 5,4 Mio. $ | 0,02 % |
117.410
+2.043
| +2 % | +118.249 $ |
2025 Q3
3 Quartale
|
|

468
Vertex Pharmaceuticals
VRTX
130 Mrd. $
| 5,4 Mio. $ | 0,02 % |
10.865
-2.492
| -19 % | -1,1 Mio. $ |
2025 Q2
4 Quartale
|
|

469
Fulton Financial
FULT
4,31 Mrd. $
| 5,38 Mio. $ | 0,02 % |
222.361
-28.203
| -11 % | -618.179 $ |
2025 Q2
4 Quartale
|
|

470
XPO
XPO
21,9 Mrd. $
| 5,37 Mio. $ | 0,02 % |
26.152
+961
| +4 % | +203.353 $ |
2025 Q4
2 Quartale
|
|

471
DT Midstream
DTM
12,6 Mrd. $
| 5,35 Mio. $ | 0,02 % |
36.456
-52.218
| -59 % | -7,39 Mio. $ |
2023 Q3
11 Quartale
|
|

472
Assured Guaranty
AGO
3,09 Mrd. $
| 5,32 Mio. $ | 0,02 % |
66.359
-5.088
| -7 % | -401.761 $ |
2024 Q2
8 Quartale
|
|

473
Maximus
MMS
3,2 Mrd. $
| 5,29 Mio. $ | 0,02 % |
98.469
+86.353
| +713 % | +5,38 Mio. $ |
2025 Q1
5 Quartale
|
|

474
Curtiss-Wright
CW
18,3 Mrd. $
| 5,28 Mio. $ | 0,02 % |
6.964
-4.211
| -38 % | -3,09 Mio. $ |
2025 Q1
5 Quartale
|
|

475
Dell
DELL
295 Mrd. $
| 5,28 Mio. $ | 0,02 % |
12.230
-211.162
| -95 % | -61,1 Mio. $ |
2025 Q4
2 Quartale
|
|
Ähnliche Fonds








Portfolio-Rückblick von Ray Dalio für Q2 2026
Zum Stand von Q2 2026 hielt Ray Dalio 1.206 Positionen im Wert von 24,4 Mrd. $, ein Anstieg um 8,8 % gegenüber 22,4 Mrd. $ im Vorquartal. Die zehn größten Positionen machen 40 % des Portfolios aus.
Ray Dalio zog im Q2 2026 netto 3,05 Mrd. $ ab, schloss 209 Positionen und reduzierte 379 Bestände. Der bemerkenswerteste Ausstieg war Cisco – eine Position im geschätzten Wert von 63,8 Mio. $, die vollständig verkauft wurde.
Nach Sektoren betrachtet ist das Portfolio mit 31 % des verwalteten Vermögens am stärksten in Sonstiges gewichtet, gegenüber 25 % im Vorquartal. Es folgen Technologie und Industrie.
Entgegen dem Trend eröffnete Ray Dalio eine neue Position in Eversource Energy im Wert von 86,4 Mio. $.
- Der größte Kauf von Ray Dalio im Q2 2026 war Eversource Energy: 1.195.140 Aktien im Wert von 86,4 Mio. $.
- Ray Dalio hat seine Position in State Street SPDR S&P 500 ETF Trust in Q2 2026 am stärksten aufgestockt – der geschätzte Zuwachs beträgt 693 Mio. $.
- Der größte Positionsabbau von Ray Dalio im Q2 2026 entfiel auf Micron Technology und belief sich schätzungsweise auf 1,02 Mrd. $.
- Ray Dalio hat seine Position in Cisco im Q2 2026 vollständig aufgelöst und dabei schätzungsweise 63,8 Mio. $ verkauft.
- Die zehn größten Positionen von Ray Dalio machen im Q2 2026 40 % des Portfolios mit einem verwalteten Vermögen von 24,4 Mrd. $ aus.
- Ray Dalio eröffnete 213 neue Positionen und schloss 209 Positionen im Q2 2026.
- Der Portfoliowert von Ray Dalio stieg gegenüber dem Vorquartal um 8,8 % auf 24,4 Mrd. $.
Auf Grundlage der von Bridgewater Associates für Q2 2026 am 14. Aug. 2026 eingereichten 13F-Meldung .