
Counterweight Ventures Portfolio-Positionen
Top-Käufe
| Rang | Aktie | Wert |
|---|---|---|
| 1 |

JPMorgan Ultra-Short Income ETF
JPST
|
+3,2 Mio. $ |
| 2 |

Micron Technology
MU
|
+332.952 $ |
| 3 |

Royal Bank of Canada
RY
|
+135.429 $ |
Größte Verkäufe
| Rang | Aktie | Wert |
|---|---|---|
| 1 |

Alphabet (Google) Class C
GOOG
|
+380.978 $ |
| 2 |

Broadcom
AVGO
|
+375.294 $ |
| 3 |

NVIDIA
NVDA
|
+302.857 $ |
| 4 |

BioCryst Pharmaceuticals
BCRX
|
+301.429 $ |
| 5 |

Apple
AAPL
|
+252.570 $ |
Sektoraufteilung
| Rang | Sektor | Gewichtung |
|---|---|---|
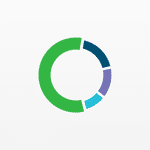
| 1 | Sonstiges | 40,91 % |
| 2 | Technologie | 19,8 % |
| 3 | Finanzwesen | 7,94 % |
| 4 | Gesundheitswesen | 6,55 % |
| 5 | Industrie | 6 % |
| Name | Marktwert | Portfolioanteil | Aktien oder Kapitalbetrag |
Änderung der Beteiligung | Kapitalfluss | Im Bestand seit | |
|---|---|---|---|---|---|---|---|

26
Duke Energy
DUK
97,9 Mrd. $
| 3,03 Mio. $ | 1,51 % |
23.961
-242
| -1 % | -30.527 $ |
2023 Q4
10 Quartale
|
|

27
iShares 1-3 Year Treasury Bond ETF
SHY
27,3 Mrd. $
| 2,82 Mio. $ | 1,41 % |
34.374
-597
| -2 % | -49.088 $ |
2023 Q4
10 Quartale
|
|

28
Amgen
AMGN
252 Mrd. $
| 2,76 Mio. $ | 1,38 % |
7.631
-264
| -3 % | -90.371 $ |
2023 Q4
10 Quartale
|
|

29
iShares Core Dividend Growth ETF
DGRO
45,2 Mrd. $
| 2,73 Mio. $ | 1,36 % |
35.966
-314
| -0,9 % | -23.165 $ |
2023 Q4
10 Quartale
|
|

30
Home Depot
HD
325 Mrd. $
| 2,69 Mio. $ | 1,34 % |
7.629
-280
| -4 % | -91.091 $ |
2023 Q4
10 Quartale
|
|

31
Advanced Micro Devices
AMD
932 Mrd. $
| 2,68 Mio. $ | 1,34 % |
4.620
| – | – |
2023 Q4
10 Quartale
|
|

32
iShares US Energy ETF
IYE
1,82 Mrd. $
| 2,6 Mio. $ | 1,29 % |
45.886
-449
| -1 % | -27.222 $ |
2023 Q4
10 Quartale
|
|

33
Tesla
TSLA
1,59 Bio. $
| 2,57 Mio. $ | 1,28 % |
6.101
-97
| -2 % | -38.578 $ |
2025 Q3
3 Quartale
|
|

34
iShares Core S&P 500 ETF
IVV
883 Mrd. $
| 2,35 Mio. $ | 1,17 % |
3.139
-25
| -0,8 % | -18.205 $ |
2023 Q4
10 Quartale
|
|

35
Cisco
CSCO
434 Mrd. $
| 2,33 Mio. $ | 1,16 % |
19.853
-20
| -0,1 % | -2.092 $ |
2023 Q4
10 Quartale
|
|

36
Quanta Services
PWR
94,6 Mrd. $
| 2,17 Mio. $ | 1,08 % |
3.011
-67
| -2 % | -45.796 $ |
2026 Q1
1 Quartal
|
|

37
GE Aerospace
GE
316 Mrd. $
| 2,16 Mio. $ | 1,08 % |
5.771
-96
| -2 % | -30.056 $ |
2025 Q3
3 Quartale
|
|

38
iShares US Basic Materials ETF
IYM
1,31 Mrd. $
| 2,1 Mio. $ | 1,05 % |
11.680
-149
| -1 % | -27.289 $ |
2023 Q4
10 Quartale
|
|

39
Phillips 66
PSX
108 Mrd. $
| 2,04 Mio. $ | 1,02 % |
12.076
-569
| -4 % | -97.947 $ |
2023 Q4
10 Quartale
|
|

40
State Street Financial Select Sector SPDR ETF
XLF
53 Mrd. $
| 1,91 Mio. $ | 0,95 % |
35.674
-456
| -1 % | -23.700 $ |
2024 Q1
9 Quartale
|
|

41
CSX Corp
CSX
97,8 Mrd. $
| 1,88 Mio. $ | 0,94 % |
39.637
-601
| -1 % | -27.137 $ |
2026 Q1
1 Quartal
|
|

42
Coca-Cola
KO
398 Mrd. $
| 1,84 Mio. $ | 0,92 % |
22.648
-326
| -1 % | -25.746 $ |
2026 Q1
1 Quartal
|
|

43
Meta Platforms (Facebook)
META
1,61 Bio. $
| 1,77 Mio. $ | 0,88 % |
3.142
-49
| -2 % | -29.963 $ |
2025 Q3
3 Quartale
|
|

44
FundStrat Granny Shots US Large Cap ETF
GRNY
4,36 Mrd. $
| 1,67 Mio. $ | 0,83 % |
60.544
-612
| -1 % | -16.278 $ |
2025 Q3
3 Quartale
|
|

45
Seagate
STX
157 Mrd. $
| 1,54 Mio. $ | 0,77 % |
1.600
| – | – |
2023 Q4
10 Quartale
|
|

46
State Street Industrial Select Sector SPDR ETF
XLI
31,1 Mrd. $
| 1,43 Mio. $ | 0,71 % |
7.724
-111
| -1 % | -19.290 $ |
2025 Q3
3 Quartale
|
|

47
iShares Ethereum Trust ETF
ETHA
7,65 Mrd. $
| 1,43 Mio. $ | 0,71 % |
40.019
-437
| -1 % | -20.351 $ |
2025 Q3
3 Quartale
|
|

48
Waste Management
WM
91,8 Mrd. $
| 1,34 Mio. $ | 0,67 % |
5.990
-228
| -4 % | -50.709 $ |
2023 Q4
10 Quartale
|
|

49
State Street Utilities Select Sector SPDR ETF
XLU
24,1 Mrd. $
| 1,29 Mio. $ | 0,64 % |
28.409
-329
| -1 % | -14.901 $ |
2024 Q3
7 Quartale
|
|

50
Palantir
PLTR
464 Mrd. $
| 1,15 Mio. $ | 0,57 % |
9.871
-752
| -7 % | -102.583 $ |
2025 Q2
4 Quartale
|
|
Ähnliche Fonds






Portfolio-Rückblick von Counterweight Ventures für Q2 2026
Zum Stand von Q2 2026 hielt Counterweight Ventures 81 Positionen im Wert von 201 Mio. $, ein Anstieg um 13 % gegenüber 178 Mio. $ im Vorquartal. Die zehn größten Positionen machen 36 % des Portfolios aus.
Der Handel war in Q2 2026 verhalten: Die Portfolio-Umschlagshäufigkeit lag bei 1,2 %. Counterweight Ventures hat eine neue Position eröffnet und keine Positionen geschlossen, sodass das Portfolio mit 81 Positionen weitgehend unverändert blieb.
Nach Sektoren ist das Portfolio mit 41 % des Vermögens am stärksten auf Sonstiges konzentriert, gegenüber 42 % ein Quartal zuvor. Es folgen Technologie und Finanzwesen.
- Der größte Kauf von Counterweight Ventures im Q2 2026 war Micron Technology: 444 Aktien im Wert von 512.505 $.
- Counterweight Ventures hat seine Position in JPMorgan Ultra-Short Income ETF in Q2 2026 am stärksten aufgestockt – der geschätzte Zuwachs beträgt 3,2 Mio. $.
- Der größte Positionsabbau von Counterweight Ventures im Q2 2026 entfiel auf Alphabet (Google) Class C und belief sich schätzungsweise auf 380.978 $.
- Die zehn größten Positionen von Counterweight Ventures machen im Q2 2026 36 % des Portfolios mit einem verwalteten Vermögen von 201 Mio. $ aus.
- Counterweight Ventures hat in Q2 2026 eine neue Position eröffnet und 0 Positionen geschlossen.
- Der Portfoliowert von Counterweight Ventures stieg gegenüber dem Vorquartal um 13 % auf 201 Mio. $.
Auf Grundlage der von Counterweight Ventures für Q2 2026 am 23. Juli 2026 eingereichten 13F-Meldung .