
Counterweight Ventures Portfolio-Positionen
Top-Käufe
| Rang | Aktie | Wert |
|---|---|---|
| 1 |

JPMorgan Ultra-Short Income ETF
JPST
|
+3,2 Mio. $ |
| 2 |

Micron Technology
MU
|
+332.952 $ |
| 3 |

Royal Bank of Canada
RY
|
+135.429 $ |
Größte Verkäufe
| Rang | Aktie | Wert |
|---|---|---|
| 1 |

Alphabet (Google) Class C
GOOG
|
+380.978 $ |
| 2 |

Broadcom
AVGO
|
+375.294 $ |
| 3 |

NVIDIA
NVDA
|
+302.857 $ |
| 4 |

BioCryst Pharmaceuticals
BCRX
|
+301.429 $ |
| 5 |

Apple
AAPL
|
+252.570 $ |
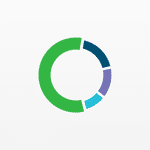
Sektoraufteilung
| Rang | Sektor | Gewichtung |
|---|---|---|
| 1 | Sonstiges | 40,91 % |
| 2 | Technologie | 19,8 % |
| 3 | Finanzwesen | 7,94 % |
| 4 | Gesundheitswesen | 6,55 % |
| 5 | Industrie | 6 % |
| Name | Marktwert | Portfolioanteil | Aktien oder Kapitalbetrag |
Änderung der Beteiligung | Kapitalfluss | Im Bestand seit | |
|---|---|---|---|---|---|---|---|

51
Vanguard Industrials ETF
VIS
7,75 Mrd. $
| 1,09 Mio. $ | 0,54 % |
3.025
| – | – |
2023 Q4
10 Quartale
|
|

52
iShares Bitcoin Trust
IBIT
55,1 Mrd. $
| 1,02 Mio. $ | 0,51 % |
30.544
-420
| -1 % | -17.085 $ |
2025 Q3
3 Quartale
|
|

53
UnitedHealth
UNH
362 Mrd. $
| 1,02 Mio. $ | 0,51 % |
2.446
-132
| -5 % | -48.926 $ |
2023 Q4
10 Quartale
|
|

54
iShares US Consumer Staples ETF
IYK
1,54 Mrd. $
| 967.323 $ | 0,48 % |
13.313
-165
| -1 % | -11.793 $ |
2026 Q1
1 Quartal
|
|

55
Chevron
CVX
427 Mrd. $
| 896.596 $ | 0,45 % |
5.409
-418
| -7 % | -77.801 $ |
2023 Q4
10 Quartale
|
|

56
RTX Corp
RTX
267 Mrd. $
| 722.871 $ | 0,36 % |
3.810
| – | – |
2023 Q4
10 Quartale
|
|

57
ExxonMobil
XOM
696 Mrd. $
| 656.803 $ | 0,33 % |
4.804
| – | – |
2023 Q4
10 Quartale
|
|
|
58
BioCryst Pharmaceuticals
BCRX
1,94 Mrd. $
| 620.500 $ | 0,31 % |
62.050
-33.334
| -35 % | -301.429 $ |
2023 Q4
10 Quartale
|
|

59
iShares MSCI EAFE Min Vol Factor ETF
EFAV
5,62 Mrd. $
| 619.057 $ | 0,31 % |
7.058
| – | – |
2023 Q4
10 Quartale
|
|

60
IBM
IBM
233 Mrd. $
| 552.859 $ | 0,28 % |
1.966
| – | – |
2024 Q3
7 Quartale
|
|

61
Zimmer Biomet
ZBH
19,7 Mrd. $
| 538.063 $ | 0,27 % |
6.250
| – | – |
2026 Q1
1 Quartal
|
|
|
62
Micron Technology
MU
856 Mrd. $
| 512.505 $ | 0,26 % |
+444
| Neu | +332.952 $ |
2026 Q2
0 Quartale
|
|

63
Marathon Petroleum
MPC
112 Mrd. $
| 482.449 $ | 0,24 % |
1.887
-340
| -15 % | -83.470 $ |
2023 Q4
10 Quartale
|
|

64
Lockheed Martin
LMT
137 Mrd. $
| 462.590 $ | 0,23 % |
908
-15
| -2 % | -8.109 $ |
2023 Q4
10 Quartale
|
|

65
NextEra Energy
NEE
178 Mrd. $
| 435.076 $ | 0,22 % |
4.957
| – | – |
2023 Q4
10 Quartale
|
|

66
Johnson & Johnson
JNJ
692 Mrd. $
| 418.035 $ | 0,21 % |
1.646
| – | – |
2023 Q4
10 Quartale
|
|

67
iShares US Healthcare ETF
IYH
4,8 Mrd. $
| 412.380 $ | 0,21 % |
6.154
| – | – |
2023 Q4
10 Quartale
|
|

68
VanEck Oil Services ETF
OIH
1,82 Mrd. $
| 388.771 $ | 0,19 % |
1.045
| – | – |
2023 Q4
10 Quartale
|
|

69
Verizon
VZ
193 Mrd. $
| 382.838 $ | 0,19 % |
9.042
-2.692
| -23 % | -126.287 $ |
2023 Q4
10 Quartale
|
|

70
State Street SPDR S&P MIDCAP 400 ETF Trust
MDY
26,2 Mrd. $
| 367.143 $ | 0,18 % |
522
| – | – |
2023 Q4
10 Quartale
|
|

71
Alphabet (Google) Class A
GOOGL
3,63 Bio. $
| 359.256 $ | 0,18 % |
1.005
| – | – |
2025 Q3
3 Quartale
|
|

72
Qualcomm
QCOM
181 Mrd. $
| 348.884 $ | 0,17 % |
1.888
| – | – |
2023 Q4
10 Quartale
|
|

73
Kimco Realty
KIM
17,1 Mrd. $
| 348.005 $ | 0,17 % |
13.728
| – | – |
2023 Q4
10 Quartale
|
|

74
Walmart Inc
WMT
1,01 Bio. $
| 326.415 $ | 0,16 % |
2.882
| – | – |
2024 Q3
7 Quartale
|
|

75
State Street SPDR S&P International Dividend ETF
DWX
522 Mio. $
| 306.780 $ | 0,15 % |
6.675
| – | – |
2023 Q4
10 Quartale
|
|
Ähnliche Fonds





Portfolio-Rückblick von Counterweight Ventures für Q2 2026
Zum Stand von Q2 2026 hielt Counterweight Ventures 81 Positionen im Wert von 201 Mio. $, ein Anstieg um 13 % gegenüber 178 Mio. $ im Vorquartal. Die zehn größten Positionen machen 36 % des Portfolios aus.
Der Handel war in Q2 2026 verhalten: Die Portfolio-Umschlagshäufigkeit lag bei 1,2 %. Counterweight Ventures hat eine neue Position eröffnet und keine Positionen geschlossen, sodass das Portfolio mit 81 Positionen weitgehend unverändert blieb.
Nach Sektoren ist das Portfolio mit 41 % des Vermögens am stärksten auf Sonstiges konzentriert, gegenüber 42 % ein Quartal zuvor. Es folgen Technologie und Finanzwesen.
- Der größte Kauf von Counterweight Ventures im Q2 2026 war Micron Technology: 444 Aktien im Wert von 512.505 $.
- Counterweight Ventures hat seine Position in JPMorgan Ultra-Short Income ETF in Q2 2026 am stärksten aufgestockt – der geschätzte Zuwachs beträgt 3,2 Mio. $.
- Der größte Positionsabbau von Counterweight Ventures im Q2 2026 entfiel auf Alphabet (Google) Class C und belief sich schätzungsweise auf 380.978 $.
- Die zehn größten Positionen von Counterweight Ventures machen im Q2 2026 36 % des Portfolios mit einem verwalteten Vermögen von 201 Mio. $ aus.
- Counterweight Ventures hat in Q2 2026 eine neue Position eröffnet und 0 Positionen geschlossen.
- Der Portfoliowert von Counterweight Ventures stieg gegenüber dem Vorquartal um 13 % auf 201 Mio. $.
Auf Grundlage der von Counterweight Ventures für Q2 2026 am 23. Juli 2026 eingereichten 13F-Meldung .