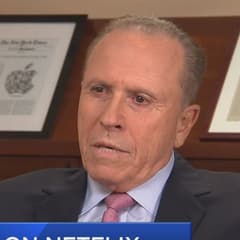
Robert Olstein Olstein Capital Management
Robert Olstein is the founder of Olstein Capital Management and a long-time advocate of forensic accounting and quality-of-earnings analysis in equity investing. His process looks beyond headline multiples to assess earnings sustainability and balance-sheet risk. Olstein’s work is frequently referenced by investors who prioritize accounting diligence.
Top Buys
| Rank | Stock | Value |
|---|---|---|
| 1 |

Walt Disney
DIS
|
+$8.64M |
| 2 |

Generac Holdings
GNRC
|
+$6.55M |
| 3 |

Skechers
SKX
|
+$4.68M |
| 4 |

Vistance Networks Inc
VISN
|
+$4.35M |
| 5 |

Goldman Sachs
GS
|
+$4.05M |
Top Sells
| Rank | Stock | Value |
|---|---|---|
| 1 |

Alphabet (Google) Class C
GOOG
|
+$9.7M |
| 2 |

Intel
INTC
|
+$7.97M |
| 3 |

Microsoft
MSFT
|
+$7.92M |
| 4 |
TFCF
Twenty-First Century Fox, Inc. Class B
TFCF
|
+$7.82M |
| 5 |

Patterson Companies, Inc.
PDCO
|
+$7.4M |
Sector Composition
| Rank | Sector | Weight |
|---|---|---|
| 1 | Technology | 19.23% |
| 2 | Industrials | 18.28% |
| 3 | Financials | 17.87% |
| 4 | Consumer Discretionary | 14.39% |
| 5 | Healthcare | 12.31% |
| Name | Market Value | Portfolio Weight | Shares or Principal |
Change in Stake | Capital Flow | Held Since | |
|---|---|---|---|---|---|---|---|

1
Apple
AAPL
$5.02T
| $18.7M | 2.48% |
404,000
-48,000
| -11% | -$2.18M |
2013 Q2
20 quarters
|
|
|
DISCK
2
DELISTED
Discovery, Inc. Series C Common Stock
DISCK
| $17.1M | 2.27% |
671,877
+39,527
| +6% | +$881K |
2014 Q4
14 quarters
|
|

3
Zimmer Biomet
ZBH
$18.1B
| $15.8M | 2.09% |
145,632
+3,966
| +3% | +$432K |
2013 Q2
20 quarters
|
|

4
WESCO International
WCC
$17B
| $13.2M | 1.75% |
231,370
+19,170
| +9% | +$1.16M |
2014 Q2
16 quarters
|
|
|
LM
5
DELISTED
Legg Mason, Inc.
LM
| $12.9M | 1.71% |
370,650
+21,727
| +6% | +$824K |
2013 Q2
20 quarters
|
|

6
Conduent
CNDT
$229M
| $12.3M | 1.64% |
678,900
-50,850
| -7% | -$982K |
2017 Q1
5 quarters
|
|

7
DELISTED
Stericycle Inc
SRCL
| $12.3M | 1.63% |
188,500
| – | – |
2016 Q3
7 quarters
|
|

8
Newell Brands
NWL
$2.37B
| $11.8M | 1.57% |
459,000
+45,000
| +11% | +$1.17M |
2016 Q4
6 quarters
|
|

9
O-I Glass
OI
$928M
| $11.6M | 1.54% |
691,400
+167,398
| +32% | +$3.23M |
2014 Q4
14 quarters
|
|

10
Zebra Technologies
ZBRA
$18.5B
| $11.5M | 1.53% |
80,400
-26,600
| -25% | -$3.92M |
2015 Q3
11 quarters
|
|

11
DELISTED
Spirit Airlines, Inc.
SAVE
| $11.2M | 1.49% |
308,500
+10,000
| +3% | +$370K |
2013 Q2
20 quarters
|
|

12
Oracle
ORCL
$391B
| $10.9M | 1.45% |
248,000
+10,000
| +4% | +$461K |
2013 Q4
18 quarters
|
|

13
Kulicke & Soffa
KLIC
$4.26B
| $10.9M | 1.45% |
457,550
+62,350
| +16% | +$1.48M |
2017 Q4
2 quarters
|
|
|
VIAB
14
DELISTED
Viacom Inc. Class B
VIAB
| $10.9M | 1.44% |
360,000
+38,000
| +12% | +$1.12M |
2015 Q1
13 quarters
|
|

15
United Parks & Resorts
PRKS
$1.38B
| $10.9M | 1.44% |
497,550
-303,650
| -38% | -$5.38M |
2016 Q2
8 quarters
|
|

16
DELISTED
Walgreens Boots Alliance
WBA
| $10.8M | 1.43% |
180,000
+20,700
| +13% | +$1.33M |
2017 Q3
3 quarters
|
|

17
CVS Health
CVS
$120B
| $10.6M | 1.4% |
164,000
-21,000
| -11% | -$1.38M |
2014 Q1
17 quarters
|
|

18
Invesco
IVZ
$12.9B
| $10.5M | 1.4% |
397,000
+71,000
| +22% | +$2.04M |
2014 Q1
17 quarters
|
|
|
19
Alphabet (Google) Class C
GOOG
$4.05T
| $10.3M | 1.36% |
184,000
-180,000
| -49% | -$9.7M |
2017 Q1
5 quarters
|
|

20
Citizens Financial Group
CFG
$27.3B
| $10M | 1.33% |
257,000
+58,400
| +29% | +$2.43M |
2015 Q1
13 quarters
|
|

21
Cisco
CSCO
$423B
| $9.8M | 1.3% |
228,000
-28,000
| -11% | -$1.22M |
2013 Q2
20 quarters
|
|

22
Keysight
KEYS
$58.1B
| $9.8M | 1.3% |
166,000
-75,981
| -31% | -$4.22M |
2015 Q1
13 quarters
|
|

23
Goodyear
GT
$1.24B
| $9.07M | 1.2% |
389,400
+63,950
| +20% | +$1.64M |
2017 Q1
5 quarters
|
|
|
24
DELISTED
Skechers
SKX
| $9.05M | 1.2% |
301,650
+146,350
| +94% | +$4.68M |
2016 Q4
6 quarters
|
|

25
Comcast
CMCSA
$78.4B
| $8.99M | 1.19% |
274,000
+11,000
| +4% | +$358K |
2013 Q3
19 quarters
|
|
Similar funds






Robert Olstein's Q2 2018 Portfolio in Review
As of Q2 2018, Robert Olstein held 118 positions worth $754M, down 4.1% from $786M the previous quarter. Its ten largest holdings account for 18% of the portfolio.
Robert Olstein withdrew a net $27.5M in Q2 2018, closing 3 positions and reducing 48 holdings. Its most notable exit was Twenty-First Century Fox, Inc. Class B, an estimated $7.82M position sold in full.
By sector, the portfolio is most concentrated in Technology at 19% of assets, down from 21% a quarter earlier, followed by Industrials and Financials.
Against the trend, Robert Olstein opened a new position in Walt Disney worth $8.86M.
- Robert Olstein's largest Q2 2018 buy was Walt Disney: 84,500 shares worth $8.86M.
- Robert Olstein added most to Skechers in Q2 2018, an estimated $4.68M increase.
- Robert Olstein's biggest Q2 2018 reduction was Alphabet (Google) Class C, cutting an estimated $9.7M.
- Robert Olstein fully exited Twenty-First Century Fox, Inc. Class B in Q2 2018, selling an estimated $7.82M.
- Robert Olstein's ten largest holdings make up 18% of its $754M portfolio in Q2 2018.
- Robert Olstein opened 5 new positions and closed 3 in Q2 2018.
- Robert Olstein's portfolio value fell 4.1% quarter-over-quarter to $754M.
Based on Olstein Capital Management's 13F filing for Q2 2018, filed 8 Aug 2018.