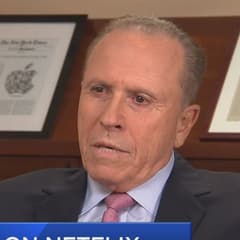
Robert Olstein Olstein Capital Management
Robert Olstein is the founder of Olstein Capital Management and a long-time advocate of forensic accounting and quality-of-earnings analysis in equity investing. His process looks beyond headline multiples to assess earnings sustainability and balance-sheet risk. Olstein’s work is frequently referenced by investors who prioritize accounting diligence.
Top Buys
| Rank | Stock | Value |
|---|---|---|
| 1 |

Oshkosh
OSK
|
+$10.7M |
| 2 |

Intel
INTC
|
+$9.11M |
| 3 |

O-I Glass
OI
|
+$8.45M |
| 4 |
JOY
Joy Global Inc
JOY
|
+$7.84M |
| 5 |

Itron
ITRI
|
+$7.12M |
Top Sells
| Rank | Stock | Value |
|---|---|---|
| 1 |

DNOW Inc
DNOW
|
+$9.21M |
| 2 |

American Express
AXP
|
+$6.42M |
| 3 |

Du Pont De Nemours E I
DD
|
+$5.77M |
| 4 |

Kohl's
KSS
|
+$5.51M |
| 5 |
WFM
Whole Foods Market Inc
WFM
|
+$4.99M |
Sector Composition
| Rank | Sector | Weight |
|---|---|---|
| 1 | Industrials | 25.15% |
| 2 | Consumer Discretionary | 21.13% |
| 3 | Technology | 16.95% |
| 4 | Financials | 13.94% |
| 5 | Healthcare | 10.46% |
| Name | Market Value | Portfolio Weight | Shares or Principal |
Change in Stake | Capital Flow | Held Since | |
|---|---|---|---|---|---|---|---|
|
HAR
1
DELISTED
Harman International Industries
HAR
| $19.1M | 2.06% |
143,000
+22,000
| +18% | +$2.74M |
2013 Q2
7 quarters
|
|

2
WESCO International
WCC
$15.5B
| $16.7M | 1.8% |
239,000
+83,000
| +53% | +$5.75M |
2014 Q2
3 quarters
|
|

3
The Greenbrier Companies
GBX
$1.18B
| $16.5M | 1.78% |
285,000
+11,000
| +4% | +$608K |
2014 Q2
3 quarters
|
|

4
Teradata
TDC
$3.24B
| $16.2M | 1.75% |
368,000
+48,000
| +15% | +$2.1M |
2013 Q2
7 quarters
|
|
|
LM
5
DELISTED
Legg Mason, Inc.
LM
| $16.1M | 1.73% |
291,000
+42,000
| +17% | +$2.36M |
2013 Q2
7 quarters
|
|

6
DELISTED
Spirit Airlines, Inc.
SAVE
| $15.2M | 1.65% |
197,000
+57,000
| +41% | +$4.37M |
2013 Q2
7 quarters
|
|

7
ABM Industries
ABM
$3.15B
| $15.2M | 1.64% |
478,000
+4,000
| +0.8% | +$121K |
2013 Q2
7 quarters
|
|
|
VSI
8
DELISTED
Vitamin Shoppe Inc.
VSI
| $14.2M | 1.53% |
344,000
+122,000
| +55% | +$5.16M |
2013 Q2
7 quarters
|
|

9
Macy's
M
$6.29B
| $14M | 1.51% |
215,000
+15,000
| +8% | +$965K |
2013 Q2
7 quarters
|
|
|
10
Itron
ITRI
$3.84B
| $13.3M | 1.44% |
365,000
+191,000
| +110% | +$7.12M |
2014 Q1
4 quarters
|
|
|
JNS
11
DELISTED
Janus Capital Group Inc
JNS
| $13.1M | 1.41% |
760,000
-33,000
| -4% | -$563K |
2013 Q2
7 quarters
|
|

12
Regal Rexnord
RRX
$9.9B
| $12.8M | 1.38% |
160,000
+12,000
| +8% | +$899K |
2013 Q2
7 quarters
|
|

13
Smith & Wesson
SWBI
$615M
| $12.7M | 1.37% |
1,296,837
-335,918
| -21% | -$3.21M |
2013 Q2
7 quarters
|
|
|
14
Intel
INTC
$460B
| $12.6M | 1.36% |
403,000
+270,000
| +203% | +$9.11M |
2013 Q2
7 quarters
|
|

15
Invesco
IVZ
$12.4B
| $12.5M | 1.35% |
316,000
+32,000
| +11% | +$1.25M |
2014 Q1
4 quarters
|
|

16
Dillards
DDS
$10.9B
| $11.9M | 1.28% |
87,000
-5,000
| -5% | -$624K |
2013 Q3
6 quarters
|
|

17
Franklin Templeton
BEN
$15.8B
| $11.8M | 1.27% |
230,000
+29,000
| +14% | +$1.54M |
2013 Q2
7 quarters
|
|
|
18
O-I Glass
OI
$994M
| $11.8M | 1.27% |
505,000
+345,000
| +216% | +$8.45M |
2014 Q4
1 quarter
|
|
|
19
Oshkosh
OSK
$8.13B
| $11.4M | 1.23% |
+234,000
| New | +$10.7M |
2015 Q1
0 quarters
|
|

20
Sensient Technologies
SXT
$5.65B
| $11.4M | 1.23% |
165,000
-13,000
| -7% | -$811K |
2013 Q2
7 quarters
|
|

21
DELISTED
Big Lots, Inc.
BIG
| $11.2M | 1.21% |
234,000
-44,000
| -16% | -$2.08M |
2013 Q2
7 quarters
|
|

22
Oracle
ORCL
$382B
| $11.1M | 1.2% |
257,000
+6,000
| +2% | +$260K |
2013 Q4
5 quarters
|
|

23
Wendy's
WEN
$1.19B
| $10.7M | 1.16% |
985,000
+295,000
| +43% | +$3.15M |
2014 Q4
1 quarter
|
|

24
Apple
AAPL
$5.07T
| $10.5M | 1.13% |
336,000
+60,000
| +22% | +$1.81M |
2013 Q2
7 quarters
|
|

25
Medtronic
MDT
$122B
| $10.5M | 1.13% |
134,000
| – | – |
2014 Q2
3 quarters
|
|
Similar funds






Robert Olstein's Q1 2015 Portfolio in Review
As of Q1 2015, Robert Olstein held 129 positions worth $926M, up 13% from $819M the previous quarter. Its ten largest holdings account for 17% of the portfolio.
Robert Olstein deployed $91.5M of net new capital in Q1 2015, opening 11 new positions and adding to 54 existing holdings. Its largest new stake was Oshkosh: 234,000 shares worth $11.4M.
By sector, the portfolio is most concentrated in Industrials at 25% of assets, up from 23% a quarter earlier, followed by Consumer Discretionary and Technology.
On the sell side, the largest reduction was Kohl's, an estimated $5.51M trimmed.
- Robert Olstein's largest Q1 2015 buy was Oshkosh: 234,000 shares worth $11.4M.
- Robert Olstein added most to Intel in Q1 2015, an estimated $9.11M increase.
- Robert Olstein's biggest Q1 2015 reduction was Kohl's, cutting an estimated $5.51M.
- Robert Olstein fully exited DNOW Inc in Q1 2015, selling an estimated $9.21M.
- Robert Olstein's ten largest holdings make up 17% of its $926M portfolio in Q1 2015.
- Robert Olstein opened 11 new positions and closed 12 in Q1 2015.
- Robert Olstein's portfolio value rose 13% quarter-over-quarter to $926M.
Based on Olstein Capital Management's 13F filing for Q1 2015, filed 13 May 2015.