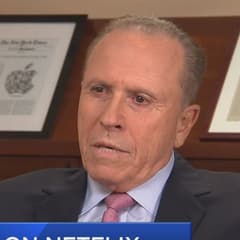
Robert Olstein Olstein Capital Management
Robert Olstein is the founder of Olstein Capital Management and a long-time advocate of forensic accounting and quality-of-earnings analysis in equity investing. His process looks beyond headline multiples to assess earnings sustainability and balance-sheet risk. Olstein’s work is frequently referenced by investors who prioritize accounting diligence.
Top Buys
| Rank | Stock | Value |
|---|---|---|
| 1 |

UnitedHealth
UNH
|
+$4.2M |
| 2 |

Adobe
ADBE
|
+$3.85M |
| 3 |

Thermo Fisher Scientific
TMO
|
+$3.34M |
| 4 |

Chubb
CB
|
+$2.3M |
| 5 |

Fiserv Inc
FISV
|
+$2.27M |
Top Sells
| Rank | Stock | Value |
|---|---|---|
| 1 |

Corteva
CTVA
|
+$3.6M |
| 2 |

Denny's
DENN
|
+$3.57M |
| 3 |

Walt Disney
DIS
|
+$2.86M |
| 4 |

L3Harris
LHX
|
+$2.64M |
| 5 |

Dine Brands
DIN
|
+$2.31M |
Sector Composition
| Rank | Sector | Weight |
|---|---|---|
| 1 | Industrials | 21.57% |
| 2 | Healthcare | 17.07% |
| 3 | Technology | 17.04% |
| 4 | Financials | 14.31% |
| 5 | Consumer Discretionary | 10.51% |
| Name | Market Value | Portfolio Weight | Shares or Principal |
Change in Stake | Capital Flow | Held Since | |
|---|---|---|---|---|---|---|---|
|
1
Walt Disney
DIS
$194B
| $13.9M | 2.6% |
112,000
-27,500
| -20% | -$2.86M |
2018 Q2
28 quarters
|
|

2
Sensata Technologies
ST
$5.88B
| $11M | 2.07% |
367,000
-79,000
| -18% | -$1.94M |
2017 Q2
32 quarters
|
|

3
Vontier
VNT
$4.65B
| $10.9M | 2.04% |
295,000
+3,000
| +1% | +$102K |
2023 Q4
6 quarters
|
|

4
ABM Industries
ABM
$3.15B
| $10M | 1.88% |
211,972
+15,972
| +8% | +$772K |
2022 Q1
13 quarters
|
|

5
Johnson & Johnson
JNJ
$635B
| $9.32M | 1.75% |
61,000
| – | – |
2020 Q2
20 quarters
|
|

6
Avantor
AVTR
$11.7B
| $9.14M | 1.71% |
679,000
+111,000
| +20% | +$1.52M |
2023 Q1
9 quarters
|
|

7
General Dynamics
GD
$94.5B
| $9.04M | 1.69% |
31,000
-2,000
| -6% | -$550K |
2024 Q1
5 quarters
|
|

8
Aptiv
APTV
$8.86B
| $8.8M | 1.65% |
129,000
-8,000
| -6% | -$495K |
2024 Q1
5 quarters
|
|

9
Becton Dickinson
BDX
$54.2B
| $8.78M | 1.65% |
51,000
+8,000
| +19% | +$1.47M |
2013 Q2
48 quarters
|
|

10
SLB Ltd
SLB
$78.3B
| $8.55M | 1.6% |
253,000
+1,000
| +0.4% | +$34.7K |
2019 Q2
24 quarters
|
|

11
WESCO International
WCC
$15.5B
| $8.5M | 1.59% |
45,900
+4,900
| +12% | +$808K |
2014 Q2
44 quarters
|
|

12
Citizens Financial Group
CFG
$27.4B
| $8.47M | 1.59% |
189,200
+3,900
| +2% | +$154K |
2015 Q1
41 quarters
|
|

13
LKQ Corp
LKQ
$4.41B
| $8.4M | 1.57% |
227,000
-34,000
| -13% | -$1.36M |
2021 Q1
17 quarters
|
|

14
Baxter International
BAX
$13.1B
| $8.14M | 1.53% |
269,000
-42,000
| -14% | -$1.27M |
2017 Q2
32 quarters
|
|

15
Nasdaq
NDAQ
$57.3B
| $8.14M | 1.53% |
91,000
-1,000
| -1% | -$79.8K |
2024 Q3
3 quarters
|
|

16
Delta Air Lines
DAL
$50.5B
| $8.07M | 1.51% |
164,000
-12,000
| -7% | -$551K |
2013 Q2
48 quarters
|
|

17
Omnicom Group
OMC
$22.7B
| $7.91M | 1.48% |
110,000
+11,000
| +11% | +$813K |
2017 Q3
31 quarters
|
|
|
18
UnitedHealth
UNH
$375B
| $7.8M | 1.46% |
25,000
+11,000
| +79% | +$4.2M |
2014 Q1
45 quarters
|
|

19
Target
TGT
$69.4B
| $7.79M | 1.46% |
79,000
+4,000
| +5% | +$384K |
2023 Q2
8 quarters
|
|

20
International Flavors & Fragrances
IFF
$24B
| $7.72M | 1.45% |
105,000
| – | – |
2022 Q4
10 quarters
|
|

21
US Bancorp
USB
$92.8B
| $7.65M | 1.43% |
169,000
+1,000
| +0.6% | +$42K |
2013 Q2
48 quarters
|
|

22
DELISTED
Hologic
HOLX
| $7.49M | 1.4% |
115,000
| – | – |
2021 Q2
16 quarters
|
|

23
Mohawk Industries
MHK
$8.45B
| $7.4M | 1.39% |
70,582
| – | – |
2018 Q3
27 quarters
|
|

24
Medtronic
MDT
$122B
| $7.32M | 1.37% |
84,000
| – | – |
2014 Q2
44 quarters
|
|

25
FedEx
FDX
$70.7B
| $7.27M | 1.36% |
32,000
+1,000
| +3% | +$219K |
2016 Q1
37 quarters
|
|
Similar funds






Robert Olstein's Q2 2025 Portfolio in Review
As of Q2 2025, Robert Olstein held 102 positions worth $533M, down 1.8% from $543M the previous quarter. Its ten largest holdings account for 19% of the portfolio.
Robert Olstein withdrew a net $16.3M in Q2 2025, closing 1 position and reducing 48 holdings. Its most notable exit was Denny's, an estimated $3.57M position sold in full.
By sector, the portfolio is most concentrated in Industrials at 22% of assets, up from 21% a quarter earlier, followed by Healthcare and Technology.
Against the trend, Robert Olstein opened a new position in Adobe worth $3.87M.
- Robert Olstein's largest Q2 2025 buy was Adobe: 10,000 shares worth $3.87M.
- Robert Olstein added most to UnitedHealth in Q2 2025, an estimated $4.2M increase.
- Robert Olstein's biggest Q2 2025 reduction was Corteva, cutting an estimated $3.6M.
- Robert Olstein fully exited Denny's in Q2 2025, selling an estimated $3.57M.
- Robert Olstein's ten largest holdings make up 19% of its $533M portfolio in Q2 2025.
- Robert Olstein opened 4 new positions and closed 1 in Q2 2025.
- Robert Olstein's portfolio value fell 1.8% quarter-over-quarter to $533M.
Based on Olstein Capital Management's 13F filing for Q2 2025, filed 22 Jul 2025.