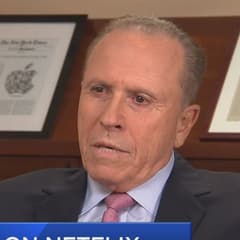
Robert Olstein Olstein Capital Management
Robert Olstein is the founder of Olstein Capital Management and a long-time advocate of forensic accounting and quality-of-earnings analysis in equity investing. His process looks beyond headline multiples to assess earnings sustainability and balance-sheet risk. Olstein’s work is frequently referenced by investors who prioritize accounting diligence.
Top Buys
| Rank | Stock | Value |
|---|---|---|
| 1 |

Middleby
MIDD
|
+$5.6M |
| 2 |

WESCO International
WCC
|
+$4.96M |
| 3 |

UnitedHealth
UNH
|
+$3.56M |
| 4 |

Aptiv
APTV
|
+$3.39M |
| 5 |

General Dynamics
GD
|
+$2.94M |
Top Sells
| Rank | Stock | Value |
|---|---|---|
| 1 |

General Motors
GM
|
+$3.89M |
| 2 |

Target
TGT
|
+$3.04M |
| 3 |

Mohawk Industries
MHK
|
+$3.03M |
| 4 |

Delta Air Lines
DAL
|
+$2.98M |
| 5 |

Meta Platforms (Facebook)
META
|
+$2.68M |
Sector Composition
| Rank | Sector | Weight |
|---|---|---|
| 1 | Industrials | 23.46% |
| 2 | Financials | 15.44% |
| 3 | Healthcare | 15.17% |
| 4 | Technology | 13.39% |
| 5 | Consumer Discretionary | 12.79% |
| Name | Market Value | Portfolio Weight | Shares or Principal |
Change in Stake | Capital Flow | Held Since | |
|---|---|---|---|---|---|---|---|

1
Walt Disney
DIS
$206B
| $14.6M | 2.38% |
119,000
-20,000
| -14% | -$2.09M |
2018 Q2
23 quarters
|
|

2
Sensata Technologies
ST
$5.63B
| $13.9M | 2.27% |
377,000
+36,000
| +11% | +$1.26M |
2017 Q2
27 quarters
|
|

3
ABM Industries
ABM
$3.22B
| $12.9M | 2.12% |
289,953
+44,953
| +18% | +$1.88M |
2022 Q1
8 quarters
|
|

4
Citizens Financial Group
CFG
$27.1B
| $11.8M | 1.94% |
326,000
-19,000
| -6% | -$623K |
2015 Q1
36 quarters
|
|
|
5
WESCO International
WCC
$15.6B
| $11.1M | 1.82% |
65,000
+30,000
| +86% | +$4.96M |
2014 Q2
39 quarters
|
|
|
6
Mohawk Industries
MHK
$8.54B
| $10.7M | 1.76% |
82,000
-27,000
| -25% | -$3.03M |
2018 Q3
22 quarters
|
|

7
Dine Brands
DIN
$450M
| $10.5M | 1.72% |
226,000
+11,000
| +5% | +$511K |
2017 Q1
28 quarters
|
|

8
CVS Health
CVS
$114B
| $10.3M | 1.68% |
129,000
-13,000
| -9% | -$993K |
2014 Q1
40 quarters
|
|

9
Kulicke & Soffa
KLIC
$3.63B
| $10.1M | 1.65% |
201,000
+27,597
| +16% | +$1.38M |
2017 Q4
25 quarters
|
|

10
SS&C Technologies
SSNC
$18.7B
| $10M | 1.64% |
155,483
-2,517
| -2% | -$156K |
2020 Q3
14 quarters
|
|

11
US Bancorp
USB
$94.4B
| $9.6M | 1.58% |
215,660
| – | – |
2013 Q2
43 quarters
|
|

12
Johnson & Johnson
JNJ
$687B
| $9.49M | 1.55% |
60,000
| – | – |
2020 Q2
15 quarters
|
|

13
Baxter International
BAX
$13.2B
| $9.49M | 1.55% |
222,000
-27,000
| -11% | -$1.1M |
2017 Q2
27 quarters
|
|

14
Jones Lang LaSalle
JLL
$16.9B
| $9.29M | 1.52% |
47,636
-201
| -0.4% | -$36.6K |
2021 Q1
12 quarters
|
|

15
International Flavors & Fragrances
IFF
$20B
| $9.29M | 1.52% |
108,000
-16,000
| -13% | -$1.28M |
2022 Q4
5 quarters
|
|

16
Corteva
CTVA
$6.2B
| $9.05M | 1.48% |
157,000
-43,000
| -22% | -$2.22M |
2019 Q3
18 quarters
|
|

17
Fifth Third Bancorp
FITB
$48.6B
| $9M | 1.47% |
242,000
-15,000
| -6% | -$522K |
2014 Q1
40 quarters
|
|

18
DELISTED
Warner Bros
WBD
| $8.94M | 1.46% |
1,024,200
| – | – |
2022 Q2
7 quarters
|
|

19
Quest Diagnostics
DGX
$28.6B
| $8.92M | 1.46% |
67,000
+9,000
| +16% | +$1.17M |
2020 Q4
13 quarters
|
|

20
Medtronic
MDT
$131B
| $8.89M | 1.45% |
102,000
| – | – |
2014 Q2
39 quarters
|
|

21
Cisco
CSCO
$380B
| $8.78M | 1.44% |
176,000
| – | – |
2013 Q2
43 quarters
|
|

22
RTX Corp
RTX
$266B
| $8.78M | 1.44% |
90,000
-6,000
| -6% | -$542K |
2013 Q2
43 quarters
|
|

23
Omnicom Group
OMC
$24B
| $8.71M | 1.42% |
90,000
-8,000
| -8% | -$718K |
2017 Q3
26 quarters
|
|

24
United Parcel Service
UPS
$94.6B
| $8.62M | 1.41% |
58,000
+10,000
| +21% | +$1.52M |
2015 Q2
35 quarters
|
|

25
Zimmer Biomet
ZBH
$19.8B
| $8.58M | 1.4% |
65,000
-1,635
| -2% | -$204K |
2013 Q2
43 quarters
|
|
Similar funds






Robert Olstein's Q1 2024 Portfolio in Review
As of Q1 2024, Robert Olstein held 100 positions worth $611M, up 3.1% from $593M the previous quarter. Its ten largest holdings account for 19% of the portfolio.
Robert Olstein withdrew a net $21.7M in Q1 2024, closing 2 positions and reducing 52 holdings. Its most notable exit was McDonald's, an estimated $1.19M position sold in full.
By sector, the portfolio is most concentrated in Industrials at 23% of assets, up from 21% a quarter earlier, followed by Financials and Healthcare.
Against the trend, Robert Olstein opened a new position in Middleby worth $6.11M.
- Robert Olstein's largest Q1 2024 buy was Middleby: 38,000 shares worth $6.11M.
- Robert Olstein added most to WESCO International in Q1 2024, an estimated $4.96M increase.
- Robert Olstein's biggest Q1 2024 reduction was General Motors, cutting an estimated $3.89M.
- Robert Olstein fully exited McDonald's in Q1 2024, selling an estimated $1.19M.
- Robert Olstein's ten largest holdings make up 19% of its $611M portfolio in Q1 2024.
- Robert Olstein opened 4 new positions and closed 2 in Q1 2024.
- Robert Olstein's portfolio value rose 3.1% quarter-over-quarter to $611M.
Based on Olstein Capital Management's 13F filing for Q1 2024, filed 19 Apr 2024.