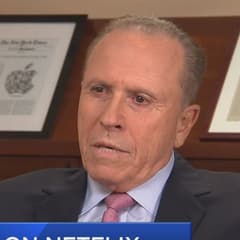
Robert Olstein Olstein Capital Management
Robert Olstein is the founder of Olstein Capital Management and a long-time advocate of forensic accounting and quality-of-earnings analysis in equity investing. His process looks beyond headline multiples to assess earnings sustainability and balance-sheet risk. Olstein’s work is frequently referenced by investors who prioritize accounting diligence.
Top Buys
| Rank | Stock | Value |
|---|---|---|
| 1 |

Johnson & Johnson
JNJ
|
+$3.79M |
| 2 |

Invesco
IVZ
|
+$3.56M |
| 3 |

Carrier Global
CARR
|
+$3.36M |
| 4 |

Wells Fargo
WFC
|
+$2.99M |
| 5 |

Tapestry
TPR
|
+$2.85M |
Top Sells
| Rank | Stock | Value |
|---|---|---|
| 1 |

Lowe's Companies
LOW
|
+$3.54M |
| 2 |

eBay
EBAY
|
+$3.3M |
| 3 |

Hologic
HOLX
|
+$3.19M |
| 4 |

S&P Global
SPGI
|
+$2.71M |
| 5 |

Mohawk Industries
MHK
|
+$2.55M |
Sector Composition
| Rank | Sector | Weight |
|---|---|---|
| 1 | Industrials | 18.34% |
| 2 | Financials | 18.12% |
| 3 | Technology | 16.24% |
| 4 | Healthcare | 14.63% |
| 5 | Consumer Discretionary | 14.05% |
| Name | Market Value | Portfolio Weight | Shares or Principal |
Change in Stake | Capital Flow | Held Since | |
|---|---|---|---|---|---|---|---|

1
Alphabet (Google) Class C
GOOG
$3.49T
| $11.7M | 2.19% |
166,000
-12,000
| -7% | -$810K |
2017 Q1
13 quarters
|
|
|
2
Invesco
IVZ
$11.9B
| $11.4M | 2.14% |
1,063,000
+397,200
| +60% | +$3.56M |
2014 Q1
25 quarters
|
|
|
DISCK
3
DELISTED
Discovery, Inc. Series C Common Stock
DISCK
| $10.4M | 1.94% |
538,000
+121,750
| +29% | +$2.38M |
2014 Q4
22 quarters
|
|

4
DELISTED
Walgreens Boots Alliance
WBA
| $10.3M | 1.92% |
242,000
+46,000
| +23% | +$1.95M |
2017 Q3
11 quarters
|
|

5
Apple
AAPL
$4.98T
| $10M | 1.87% |
110,000
| – | – |
2013 Q2
28 quarters
|
|

6
Cisco
CSCO
$370B
| $9.9M | 1.85% |
212,000
| – | – |
2013 Q2
28 quarters
|
|

7
Zimmer Biomet
ZBH
$20B
| $9.5M | 1.78% |
82,400
-4,429
| -5% | -$510K |
2013 Q2
28 quarters
|
|

8
Becton Dickinson
BDX
$57.7B
| $9.45M | 1.77% |
40,488
+4,613
| +13% | +$1.11M |
2013 Q2
28 quarters
|
|

9
CVS Health
CVS
$107B
| $9.36M | 1.75% |
144,000
| – | – |
2014 Q1
25 quarters
|
|

10
Intel
INTC
$299B
| $9.09M | 1.7% |
152,000
-16,000
| -10% | -$957K |
2013 Q2
28 quarters
|
|

11
Generac Holdings
GNRC
$10.4B
| $9.02M | 1.69% |
74,000
-17,600
| -19% | -$1.85M |
2018 Q2
8 quarters
|
|

12
Citizens Financial Group
CFG
$26.5B
| $8.91M | 1.66% |
352,900
+10,000
| +3% | +$227K |
2015 Q1
21 quarters
|
|

13
Corning
GLW
$91.4B
| $8.81M | 1.65% |
340,000
+44,000
| +15% | +$998K |
2013 Q4
26 quarters
|
|

14
DELISTED
Paramount Global Class B
PARA
| $8.32M | 1.56% |
357,000
-25,000
| -7% | -$482K |
2019 Q4
2 quarters
|
|

15
FedEx
FDX
$72.2B
| $8.13M | 1.52% |
58,000
-3,000
| -5% | -$377K |
2016 Q1
17 quarters
|
|

16
DELISTED
WestRock Company
WRK
| $8.11M | 1.52% |
287,000
+52,900
| +23% | +$1.5M |
2016 Q1
17 quarters
|
|

17
Omnicom Group
OMC
$23.7B
| $8.08M | 1.51% |
148,000
+36,000
| +32% | +$1.96M |
2017 Q3
11 quarters
|
|

18
WESCO International
WCC
$14.2B
| $8M | 1.5% |
228,000
-52,000
| -19% | -$1.55M |
2014 Q2
24 quarters
|
|

19
Medtronic
MDT
$130B
| $7.89M | 1.47% |
86,000
+15,000
| +21% | +$1.44M |
2014 Q2
24 quarters
|
|

20
Walt Disney
DIS
$202B
| $7.87M | 1.47% |
70,600
| – | – |
2018 Q2
8 quarters
|
|

21
Goldman Sachs
GS
$250B
| $7.71M | 1.44% |
39,000
+2,000
| +5% | +$375K |
2018 Q2
8 quarters
|
|

22
Middleby
MIDD
$6.17B
| $7.68M | 1.44% |
97,300
+9,050
| +10% | +$586K |
2019 Q3
3 quarters
|
|
|
23
Wells Fargo
WFC
$252B
| $7.48M | 1.4% |
292,000
+109,100
| +60% | +$2.99M |
2017 Q4
10 quarters
|
|

24
Meta Platforms (Facebook)
META
$1.56T
| $6.9M | 1.29% |
30,400
| – | – |
2020 Q1
1 quarter
|
|

25
United Parcel Service
UPS
$92.2B
| $6.89M | 1.29% |
62,000
-22,000
| -26% | -$2.2M |
2015 Q2
20 quarters
|
|
Similar funds






Robert Olstein's Q2 2020 Portfolio in Review
As of Q2 2020, Robert Olstein held 105 positions worth $535M, up 17% from $456M the previous quarter. Its ten largest holdings account for 19% of the portfolio.
Robert Olstein withdrew a net $19M in Q2 2020, closing 1 position and reducing 50 holdings. Its most notable exit was Spirit Airlines, Inc., an estimated $1.11M position sold in full.
By sector, the portfolio is most concentrated in Industrials at 18% of assets, down from 20% a quarter earlier, followed by Financials and Technology.
Against the trend, Robert Olstein opened a new position in Johnson & Johnson worth $3.66M.
- Robert Olstein's largest Q2 2020 buy was Johnson & Johnson: 26,000 shares worth $3.66M.
- Robert Olstein added most to Invesco in Q2 2020, an estimated $3.56M increase.
- Robert Olstein's biggest Q2 2020 reduction was Lowe's Companies, cutting an estimated $3.54M.
- Robert Olstein fully exited Spirit Airlines, Inc. in Q2 2020, selling an estimated $1.11M.
- Robert Olstein's ten largest holdings make up 19% of its $535M portfolio in Q2 2020.
- Robert Olstein opened 5 new positions and closed 1 in Q2 2020.
- Robert Olstein's portfolio value rose 17% quarter-over-quarter to $535M.
Based on Olstein Capital Management's 13F filing for Q2 2020, filed 12 Aug 2020.