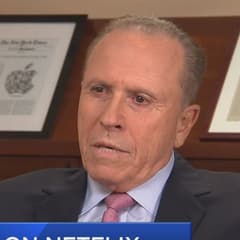
Robert Olstein Olstein Capital Management
Robert Olstein is the founder of Olstein Capital Management and a long-time advocate of forensic accounting and quality-of-earnings analysis in equity investing. His process looks beyond headline multiples to assess earnings sustainability and balance-sheet risk. Olstein’s work is frequently referenced by investors who prioritize accounting diligence.
Top Buys
| Rank | Stock | Value |
|---|---|---|
| 1 |

Kulicke & Soffa
KLIC
|
+$6.34M |
| 2 |

Casey's General Stores
CASY
|
+$5.46M |
| 3 |

Vistance Networks Inc
VISN
|
+$5.31M |
| 4 |

Franklin Templeton
BEN
|
+$4.89M |
| 5 |

Newell Brands
NWL
|
+$4.86M |
Top Sells
| Rank | Stock | Value |
|---|---|---|
| 1 |

Western Digital
WDC
|
+$5.7M |
| 2 |

Charles River Laboratories
CRL
|
+$5.28M |
| 3 |

United Parks & Resorts
PRKS
|
+$4.69M |
| 4 |

Harley-Davidson
HOG
|
+$4.48M |
| 5 |

Oracle
ORCL
|
+$4.42M |
Sector Composition
| Rank | Sector | Weight |
|---|---|---|
| 1 | Technology | 20.89% |
| 2 | Financials | 16.84% |
| 3 | Industrials | 16.47% |
| 4 | Consumer Discretionary | 14.58% |
| 5 | Healthcare | 13.66% |
| Name | Market Value | Portfolio Weight | Shares or Principal |
Change in Stake | Capital Flow | Held Since | |
|---|---|---|---|---|---|---|---|

1
Apple
AAPL
$5.02T
| $19M | 2.41% |
452,000
| – | – |
2013 Q2
19 quarters
|
|

2
Alphabet (Google) Class C
GOOG
$3.94T
| $18.8M | 2.39% |
364,000
-56,000
| -13% | -$3.09M |
2017 Q1
4 quarters
|
|

3
Intel
INTC
$505B
| $17M | 2.17% |
326,900
-59,100
| -15% | -$2.81M |
2013 Q2
19 quarters
|
|

4
Zimmer Biomet
ZBH
$18.4B
| $15M | 1.91% |
141,666
-4,810
| -3% | -$559K |
2013 Q2
19 quarters
|
|

5
Zebra Technologies
ZBRA
$18.2B
| $14.9M | 1.89% |
107,000
-23,250
| -18% | -$2.98M |
2015 Q3
10 quarters
|
|
|
LM
6
DELISTED
Legg Mason, Inc.
LM
| $14.2M | 1.8% |
348,923
-16,747
| -5% | -$691K |
2013 Q2
19 quarters
|
|

7
Conduent
CNDT
$246M
| $13.6M | 1.73% |
729,750
| – | – |
2017 Q1
4 quarters
|
|

8
Microsoft
MSFT
$3.94T
| $13.5M | 1.72% |
148,000
+48,000
| +48% | +$4.39M |
2013 Q2
19 quarters
|
|

9
WESCO International
WCC
$16.5B
| $13.2M | 1.67% |
212,200
| – | – |
2014 Q2
15 quarters
|
|

10
Keysight
KEYS
$57.1B
| $12.7M | 1.61% |
241,981
-62,394
| -20% | -$2.98M |
2015 Q1
12 quarters
|
|
|
DISCK
11
DELISTED
Discovery, Inc. Series C Common Stock
DISCK
| $12.3M | 1.57% |
632,350
-162,900
| -20% | -$3.65M |
2014 Q4
13 quarters
|
|
|
12
United Parks & Resorts
PRKS
$1.41B
| $11.9M | 1.51% |
801,200
-318,800
| -28% | -$4.69M |
2016 Q2
7 quarters
|
|

13
CVS Health
CVS
$115B
| $11.5M | 1.46% |
185,000
+48,500
| +36% | +$3.48M |
2014 Q1
16 quarters
|
|

14
O-I Glass
OI
$865M
| $11.4M | 1.44% |
524,002
+40,002
| +8% | +$886K |
2014 Q4
13 quarters
|
|

15
DELISTED
Spirit Airlines, Inc.
SAVE
| $11.3M | 1.43% |
298,500
+33,100
| +12% | +$1.39M |
2013 Q2
19 quarters
|
|

16
DELISTED
Stericycle Inc
SRCL
| $11M | 1.4% |
188,500
-38,250
| -17% | -$2.59M |
2016 Q3
6 quarters
|
|

17
Cisco
CSCO
$435B
| $11M | 1.4% |
256,000
-25,000
| -9% | -$1.06M |
2013 Q2
19 quarters
|
|
|
18
Oracle
ORCL
$438B
| $10.9M | 1.38% |
238,000
-89,000
| -27% | -$4.42M |
2013 Q4
17 quarters
|
|
|
19
Newell Brands
NWL
$2.22B
| $10.5M | 1.34% |
414,000
+172,000
| +71% | +$4.86M |
2016 Q4
5 quarters
|
|

20
Invesco
IVZ
$12.6B
| $10.4M | 1.33% |
326,000
+49,200
| +18% | +$1.7M |
2014 Q1
16 quarters
|
|

21
DELISTED
Walgreens Boots Alliance
WBA
| $10.4M | 1.33% |
159,300
+15,300
| +11% | +$1.09M |
2017 Q3
2 quarters
|
|

22
Regal Rexnord
RRX
$10.7B
| $10.4M | 1.32% |
141,550
+31,950
| +29% | +$2.4M |
2013 Q2
19 quarters
|
|
|
VIAB
23
DELISTED
Viacom Inc. Class B
VIAB
| $10M | 1.27% |
322,000
+33,065
| +11% | +$1.07M |
2015 Q1
12 quarters
|
|
|
24
Kulicke & Soffa
KLIC
$4.16B
| $9.9M | 1.26% |
395,200
+263,050
| +199% | +$6.34M |
2017 Q4
1 quarter
|
|

25
Delta Air Lines
DAL
$52.9B
| $9.48M | 1.21% |
173,000
+18,000
| +12% | +$993K |
2013 Q2
19 quarters
|
|
Similar funds






Robert Olstein's Q1 2018 Portfolio in Review
As of Q1 2018, Robert Olstein held 117 positions worth $786M, up 0.14% from $785M the previous quarter. Its ten largest holdings account for 19% of the portfolio.
Robert Olstein's Q1 2018 filing shows 7 new, 50 increased, 41 reduced and 4 closed positions. Its largest new stake was Casey's General Stores: 47,178 shares worth $5.18M. The largest sale was Western Digital, an estimated $5.7M.
By sector, the portfolio is most concentrated in Technology at 21% of assets, up from 19% a quarter earlier, followed by Financials and Industrials.
- Robert Olstein's largest Q1 2018 buy was Casey's General Stores: 47,178 shares worth $5.18M.
- Robert Olstein added most to Kulicke & Soffa in Q1 2018, an estimated $6.34M increase.
- Robert Olstein's biggest Q1 2018 reduction was Western Digital, cutting an estimated $5.7M.
- Robert Olstein fully exited Charles River Laboratories in Q1 2018, selling an estimated $5.28M.
- Robert Olstein's ten largest holdings make up 19% of its $786M portfolio in Q1 2018.
- Robert Olstein opened 7 new positions and closed 4 in Q1 2018.
- Robert Olstein's portfolio value rose 0.14% quarter-over-quarter to $786M.
Based on Olstein Capital Management's 13F filing for Q1 2018, filed 4 May 2018.