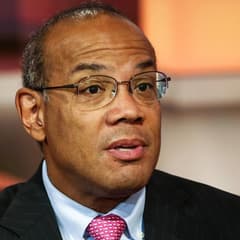
John Rogers Ariel Investments
John W. Rogers Jr. is the founder of Ariel Investments, one of the best-known minority-owned investment firms in the United States. Ariel is associated with patient, value-oriented investing and a long-term “slow and steady” culture. Rogers is also a prominent voice on markets, corporate leadership, and inclusive capitalism.
Top Buys
| Rank | Stock | Value |
|---|---|---|
| 1 |

Leslie's
LESL
|
+$56.5M |
| 2 |

J.M. Smucker
SJM
|
+$55.1M |
| 3 |

Manchester United
MANU
|
+$43M |
| 4 |

Allstate
ALL
|
+$40M |
| 5 |

Middleby
MIDD
|
+$25.4M |
Top Sells
| Rank | Stock | Value |
|---|---|---|
| 1 |

Stericycle
SRCL
|
+$139M |
| 2 |

Resideo Technologies
REZI
|
+$50.4M |
| 3 |

Microsoft
MSFT
|
+$42.4M |
| 4 |

Brink's
BCO
|
+$42.2M |
| 5 |

DaVita
DVA
|
+$35.4M |
Sector Composition
| Rank | Sector | Weight |
|---|---|---|
| 1 | Financials | 20.29% |
| 2 | Consumer Discretionary | 19.01% |
| 3 | Industrials | 15.87% |
| 4 | Communication Services | 13.1% |
| 5 | Healthcare | 9.39% |
| Name | Market Value | Portfolio Weight | Shares or Principal |
Change in Stake | Capital Flow | Held Since | |
|---|---|---|---|---|---|---|---|

1
Jones Lang LaSalle
JLL
$15.8B
| $272M | 2.95% |
1,326,074
-110,581
| -8% | -$21.5M |
2013 Q2
44 quarters
|
|

2
Generac Holdings
GNRC
$11.4B
| $255M | 2.76% |
1,928,250
-214,602
| -10% | -$29.7M |
2022 Q2
8 quarters
|
|

3
Mattel
MAT
$3.91B
| $241M | 2.61% |
14,818,010
-765,283
| -5% | -$13.9M |
2015 Q2
36 quarters
|
|

4
ADT
ADT
$7.21B
| $231M | 2.5% |
30,360,559
+780,762
| +3% | +$5.41M |
2021 Q2
12 quarters
|
|

5
Lazard
LAZ
$3.82B
| $231M | 2.5% |
6,041,656
-277,002
| -4% | -$10.8M |
2013 Q2
44 quarters
|
|

6
Affiliated Managers Group
AMG
$9.09B
| $225M | 2.44% |
1,442,817
+115,808
| +9% | +$18.4M |
2018 Q3
23 quarters
|
|

7
Madison Square Garden
MSGE
$3.69B
| $224M | 2.43% |
6,550,028
-440,916
| -6% | -$16.3M |
2023 Q2
4 quarters
|
|

8
Northern Trust
NTRS
$29.4B
| $222M | 2.4% |
2,644,205
+91,816
| +4% | +$7.71M |
2013 Q2
44 quarters
|
|

9
Check Point Software Technologies
CHKP
$15.8B
| $220M | 2.39% |
1,336,278
-46,255
| -3% | -$7.21M |
2020 Q1
17 quarters
|
|

10
Core Laboratories
CLB
$356M
| $209M | 2.26% |
10,292,296
-533,361
| -5% | -$9.44M |
2020 Q2
16 quarters
|
|

11
Mohawk Industries
MHK
$8.19B
| $206M | 2.23% |
1,816,676
-54,084
| -3% | -$6.29M |
2013 Q2
44 quarters
|
|

12
Gentex
GNTX
$3.85B
| $206M | 2.23% |
6,103,580
-302,779
| -5% | -$10.5M |
2021 Q3
11 quarters
|
|

13
Kennametal
KMT
$1.64B
| $204M | 2.21% |
8,660,974
-535,468
| -6% | -$13.2M |
2014 Q2
40 quarters
|
|

14
Covista
CVSA
$3.63B
| $201M | 2.17% |
2,941,733
-137,584
| -4% | -$8.07M |
2013 Q2
44 quarters
|
|

15
Carlyle Group
CG
$12.7B
| $198M | 2.15% |
4,937,725
+54,805
| +1% | +$2.37M |
2022 Q4
6 quarters
|
|

16
Prestige Consumer Healthcare
PBH
$2.35B
| $195M | 2.11% |
2,835,203
+274,212
| +11% | +$18.6M |
2022 Q2
8 quarters
|
|

17
First American
FAF
$6.59B
| $195M | 2.11% |
3,609,697
+97,158
| +3% | +$5.4M |
2013 Q2
44 quarters
|
|

18
Sphere Entertainment
SPHR
$4.33B
| $194M | 2.1% |
5,538,121
+419,581
| +8% | +$16.3M |
2020 Q2
16 quarters
|
|

19
Royal Caribbean
RCL
$79.3B
| $189M | 2.04% |
1,184,249
-47,964
| -4% | -$6.9M |
2013 Q2
44 quarters
|
|
|
20
Resideo Technologies
REZI
$3.1B
| $188M | 2.03% |
9,590,360
-2,436,140
| -20% | -$50.4M |
2021 Q3
11 quarters
|
|

21
Charles River Laboratories
CRL
$15.1B
| $187M | 2.03% |
906,137
-26,670
| -3% | -$6.04M |
2013 Q2
44 quarters
|
|

22
MSG Knickerbockers
MSGK
$7.32B
| $183M | 1.98% |
970,156
+33,031
| +4% | +$6.12M |
2013 Q2
44 quarters
|
|

23
BOK Financial
BOKF
$7.57B
| $176M | 1.9% |
1,915,225
-239,164
| -11% | -$21.6M |
2016 Q2
32 quarters
|
|

24
Boyd Gaming
BYD
$5.28B
| $167M | 1.81% |
3,031,691
+335,984
| +12% | +$19.2M |
2021 Q3
11 quarters
|
|

25
DELISTED
Interpublic Group of Companies
IPG
| $166M | 1.8% |
5,710,448
+193,898
| +4% | +$5.98M |
2013 Q2
44 quarters
|
|
Similar funds





John Rogers's Q2 2024 Portfolio in Review
As of Q2 2024, John Rogers held 120 positions worth $9.24B, down 9.1% from $10.2B the previous quarter. Its ten largest holdings account for 25% of the portfolio.
John Rogers withdrew a net $333M in Q2 2024, closing 5 positions and reducing 70 holdings. Its most notable exit was Horace Mann Educators, an estimated $9.29M position sold in full.
By sector, the portfolio is most concentrated in Financials at 20% of assets, up from 20% a quarter earlier, followed by Consumer Discretionary and Industrials.
Against the trend, John Rogers opened a new position in Allstate worth $38.3M.
- John Rogers's largest Q2 2024 buy was Allstate: 240,042 shares worth $38.3M.
- John Rogers added most to Leslie's in Q2 2024, an estimated $56.5M increase.
- John Rogers's biggest Q2 2024 reduction was Stericycle, cutting an estimated $139M.
- John Rogers fully exited Horace Mann Educators in Q2 2024, selling an estimated $9.29M.
- John Rogers's ten largest holdings make up 25% of its $9.24B portfolio in Q2 2024.
- John Rogers opened 5 new positions and closed 5 in Q2 2024.
- John Rogers's portfolio value fell 9.1% quarter-over-quarter to $9.24B.
Based on Ariel Investments's 13F filing for Q2 2024, filed 14 Aug 2024.