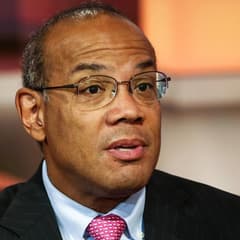
John Rogers Ariel Investments
John W. Rogers Jr. is the founder of Ariel Investments, one of the best-known minority-owned investment firms in the United States. Ariel is associated with patient, value-oriented investing and a long-term “slow and steady” culture. Rogers is also a prominent voice on markets, corporate leadership, and inclusive capitalism.
Top Buys
| Rank | Stock | Value |
|---|---|---|
| 1 |

Cardinal Health
CAH
|
+$55.9M |
| 2 |
NLSN
Nielsen Holdings plc
NLSN
|
+$53M |
| 3 |

Charles River Laboratories
CRL
|
+$41.1M |
| 4 |

Nokia
NOK
|
+$28.4M |
| 5 |

Occidental Petroleum
OXY
|
+$21.5M |
Top Sells
| Rank | Stock | Value |
|---|---|---|
| 1 |
HAR
Harman International Industries
HAR
|
+$115M |
| 2 |

Kennametal
KMT
|
+$55.4M |
| 3 |

Bio-Rad Laboratories Class A
BIO
|
+$40.9M |
| 4 |
AXE
Anixter International Inc
AXE
|
+$40.7M |
| 5 |
CEB
CEB Inc.
CEB
|
+$40.3M |
Sector Composition
| Rank | Sector | Weight |
|---|---|---|
| 1 | Financials | 21.92% |
| 2 | Communication Services | 15.18% |
| 3 | Industrials | 14.88% |
| 4 | Healthcare | 13.96% |
| 5 | Technology | 12.85% |
| Name | Market Value | Portfolio Weight | Shares or Principal |
Change in Stake | Capital Flow | Held Since | |
|---|---|---|---|---|---|---|---|

1
Lazard
LAZ
$4.34B
| $277M | 3.26% |
6,020,949
-462,426
| -7% | -$19.9M |
2013 Q2
15 quarters
|
|
|
2
Kennametal
KMT
$1.85B
| $227M | 2.67% |
5,778,984
-1,504,834
| -21% | -$55.4M |
2014 Q2
11 quarters
|
|

3
First American
FAF
$6.62B
| $216M | 2.54% |
5,503,113
-8,828
| -0.2% | -$338K |
2013 Q2
15 quarters
|
|

4
Labcorp
LH
$30.1B
| $200M | 2.36% |
1,625,360
-86,116
| -5% | -$10.2M |
2014 Q1
12 quarters
|
|

5
Baidu
BIDU
$26.6B
| $192M | 2.25% |
1,111,024
+64,821
| +6% | +$11.4M |
2013 Q2
15 quarters
|
|
|
6
Charles River Laboratories
CRL
$16.2B
| $185M | 2.18% |
2,060,420
+483,564
| +31% | +$41.1M |
2013 Q2
15 quarters
|
|

7
DELISTED
Interpublic Group of Companies
IPG
| $185M | 2.17% |
7,517,443
-122,117
| -2% | -$2.93M |
2013 Q2
15 quarters
|
|

8
Northern Trust
NTRS
$32.3B
| $180M | 2.12% |
2,080,359
-70,093
| -3% | -$6.09M |
2013 Q2
15 quarters
|
|
|
9
Nokia
NOK
$45.7B
| $175M | 2.06% |
32,372,988
+5,650,498
| +21% | +$28.4M |
2013 Q2
15 quarters
|
|

10
Zebra Technologies
ZBRA
$15.3B
| $174M | 2.05% |
1,907,004
-232,833
| -11% | -$20.2M |
2013 Q4
13 quarters
|
|

11
Microsoft
MSFT
$3.89T
| $168M | 1.97% |
2,548,452
-89
| -0% | -$5.7K |
2013 Q2
15 quarters
|
|

12
KKR & Co
KKR
$87.5B
| $159M | 1.87% |
8,733,093
-1,624,362
| -16% | -$28.9M |
2013 Q2
15 quarters
|
|
|
VIAB
13
DELISTED
Viacom Inc. Class B
VIAB
| $158M | 1.86% |
3,387,566
-306,195
| -8% | -$12.9M |
2013 Q2
15 quarters
|
|

14
Jones Lang LaSalle
JLL
$16.8B
| $157M | 1.85% |
1,410,396
-144,026
| -9% | -$15.7M |
2013 Q2
15 quarters
|
|
|
BRS
15
DELISTED
Bristow Group, Inc.
BRS
| $155M | 1.82% |
10,160,521
+371,009
| +4% | +$6.24M |
2013 Q2
15 quarters
|
|
|
MSGN
16
DELISTED
MSG Networks Inc.
MSGN
| $146M | 1.72% |
6,251,368
-293,794
| -4% | -$6.57M |
2015 Q4
5 quarters
|
|

17
DELISTED
TEGNA Inc
TGNA
| $141M | 1.66% |
8,596,820
-1,326,621
| -13% | -$20.4M |
2013 Q2
15 quarters
|
|

18
J.M. Smucker
SJM
$14.2B
| $137M | 1.61% |
1,043,291
-40,487
| -4% | -$5.5M |
2013 Q2
15 quarters
|
|

19
Keysight
KEYS
$50.7B
| $135M | 1.58% |
3,722,785
+402,761
| +12% | +$15M |
2016 Q4
1 quarter
|
|
|
20
Bio-Rad Laboratories Class A
BIO
$9.9B
| $134M | 1.58% |
674,360
-212,467
| -24% | -$40.9M |
2013 Q2
15 quarters
|
|

21
Zimmer Biomet
ZBH
$19.5B
| $132M | 1.55% |
1,109,215
-54,225
| -5% | -$6.15M |
2013 Q2
15 quarters
|
|

22
Mattel
MAT
$4.32B
| $130M | 1.53% |
5,073,346
+612,807
| +14% | +$16.4M |
2015 Q2
7 quarters
|
|

23
Gilead Sciences
GILD
$208B
| $122M | 1.44% |
1,800,201
+216,002
| +14% | +$15.2M |
2013 Q2
15 quarters
|
|

24
CBRE Group
CBRE
$38.4B
| $120M | 1.42% |
3,463,449
-358,307
| -9% | -$12M |
2013 Q2
15 quarters
|
|

25
Aflac
AFL
$63.1B
| $117M | 1.37% |
3,218,684
-28,854
| -0.9% | -$1.02M |
2013 Q2
15 quarters
|
|
Similar funds







John Rogers's Q1 2017 Portfolio in Review
As of Q1 2017, John Rogers held 200 positions worth $8.51B, up 0.41% from $8.47B the previous quarter. Its ten largest holdings account for 24% of the portfolio.
John Rogers withdrew a net $436M in Q1 2017, closing 12 positions and reducing 107 holdings. Its most notable exit was Harman International Industries, an estimated $115M position sold in full.
By sector, the portfolio is most concentrated in Financials at 22% of assets, down from 22% a quarter earlier, followed by Communication Services and Industrials.
Against the trend, John Rogers opened a new position in Nielsen Holdings plc worth $51.2M.
- John Rogers's largest Q1 2017 buy was Nielsen Holdings plc: 1,238,592 shares worth $51.2M.
- John Rogers added most to Cardinal Health in Q1 2017, an estimated $55.9M increase.
- John Rogers's biggest Q1 2017 reduction was Kennametal, cutting an estimated $55.4M.
- John Rogers fully exited Harman International Industries in Q1 2017, selling an estimated $115M.
- John Rogers's ten largest holdings make up 24% of its $8.51B portfolio in Q1 2017.
- John Rogers opened 10 new positions and closed 12 in Q1 2017.
- John Rogers's portfolio value rose 0.41% quarter-over-quarter to $8.51B.
Based on Ariel Investments's 13F filing for Q1 2017, filed 11 May 2017.