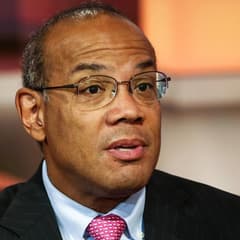
John Rogers Ariel Investments
John W. Rogers Jr. is the founder of Ariel Investments, one of the best-known minority-owned investment firms in the United States. Ariel is associated with patient, value-oriented investing and a long-term “slow and steady” culture. Rogers is also a prominent voice on markets, corporate leadership, and inclusive capitalism.
Top Buys
| Rank | Stock | Value |
|---|---|---|
| 1 |

Philip Morris
PM
|
+$95.9M |
| 2 |
NLSN
Nielsen Holdings plc
NLSN
|
+$30.3M |
| 3 |

Mattel
MAT
|
+$19.9M |
| 4 |

Verizon
VZ
|
+$14.9M |
| 5 |

Paramount Global Class B
PARA
|
+$14.6M |
Top Sells
| Rank | Stock | Value |
|---|---|---|
| 1 |

Jones Lang LaSalle
JLL
|
+$43.3M |
| 2 |

Keysight
KEYS
|
+$40.8M |
| 3 |

Occidental Petroleum
OXY
|
+$24.5M |
| 4 |

KKR & Co
KKR
|
+$24.1M |
| 5 |

NOV
NOV
|
+$23M |
Sector Composition
| Rank | Sector | Weight |
|---|---|---|
| 1 | Financials | 21.24% |
| 2 | Communication Services | 15.57% |
| 3 | Industrials | 13.66% |
| 4 | Technology | 13.45% |
| 5 | Healthcare | 12.14% |
| Name | Market Value | Portfolio Weight | Shares or Principal |
Change in Stake | Capital Flow | Held Since | |
|---|---|---|---|---|---|---|---|

1
Baidu
BIDU
$26.6B
| $288M | 3.23% |
1,184,062
+56,882
| +5% | +$14.2M |
2013 Q2
20 quarters
|
|

2
Microsoft
MSFT
$3.91T
| $274M | 3.08% |
2,782,243
+33,725
| +1% | +$3.27M |
2013 Q2
20 quarters
|
|

3
First American
FAF
$6.62B
| $234M | 2.62% |
4,519,761
-890
| -0% | -$47.4K |
2013 Q2
20 quarters
|
|
|
4
Keysight
KEYS
$51.9B
| $229M | 2.56% |
3,871,085
-733,495
| -16% | -$40.8M |
2016 Q4
6 quarters
|
|
|
MSGN
5
DELISTED
MSG Networks Inc.
MSGN
| $218M | 2.45% |
9,114,348
+45,018
| +0.5% | +$954K |
2015 Q4
10 quarters
|
|

6
Lazard
LAZ
$4.43B
| $217M | 2.43% |
4,433,359
-76,399
| -2% | -$4.04M |
2013 Q2
20 quarters
|
|

7
Labcorp
LH
$30.3B
| $203M | 2.28% |
1,319,353
-61,945
| -4% | -$9.35M |
2014 Q1
17 quarters
|
|

8
Kennametal
KMT
$1.88B
| $196M | 2.2% |
5,459,382
+272,428
| +5% | +$10.5M |
2014 Q2
16 quarters
|
|

9
J.M. Smucker
SJM
$14.2B
| $190M | 2.13% |
1,767,460
+108,828
| +7% | +$12.2M |
2013 Q2
20 quarters
|
|

10
Northern Trust
NTRS
$32.3B
| $186M | 2.09% |
1,809,965
-359
| -0% | -$38K |
2013 Q2
20 quarters
|
|
|
11
Mattel
MAT
$4.51B
| $184M | 2.06% |
11,183,832
+1,314,295
| +13% | +$19.9M |
2015 Q2
12 quarters
|
|

12
DELISTED
Interpublic Group of Companies
IPG
| $181M | 2.03% |
7,706,271
+28,507
| +0.4% | +$670K |
2013 Q2
20 quarters
|
|
|
13
Philip Morris
PM
$310B
| $177M | 1.98% |
2,187,710
+1,129,516
| +107% | +$95.9M |
2013 Q3
19 quarters
|
|
|
14
KKR & Co
KKR
$87.3B
| $168M | 1.89% |
6,761,084
-1,082,639
| -14% | -$24.1M |
2013 Q2
20 quarters
|
|

15
Gilead Sciences
GILD
$211B
| $165M | 1.85% |
2,329,260
+159,941
| +7% | +$11.3M |
2013 Q2
20 quarters
|
|

16
Zebra Technologies
ZBRA
$15B
| $152M | 1.71% |
1,062,680
-147,137
| -12% | -$21.7M |
2013 Q4
18 quarters
|
|
|
NLSN
17
DELISTED
Nielsen Holdings plc
NLSN
| $151M | 1.7% |
4,891,462
+966,961
| +25% | +$30.3M |
2017 Q1
5 quarters
|
|

18
Snap-on
SNA
$19.2B
| $149M | 1.68% |
929,933
+84,287
| +10% | +$12.8M |
2013 Q2
20 quarters
|
|

19
DELISTED
U.S. SILICA HOLDINGS, INC.
SLCA
| $149M | 1.67% |
5,800,668
-170,239
| -3% | -$4.99M |
2013 Q3
19 quarters
|
|

20
Charles River Laboratories
CRL
$16.3B
| $148M | 1.66% |
1,317,586
-43,691
| -3% | -$4.72M |
2013 Q2
20 quarters
|
|

21
Nokia
NOK
$47.3B
| $139M | 1.56% |
24,242,239
+187,280
| +0.8% | +$1.11M |
2013 Q2
20 quarters
|
|
|
BRS
22
DELISTED
Bristow Group, Inc.
BRS
| $135M | 1.51% |
9,534,740
-558,421
| -6% | -$8.34M |
2013 Q2
20 quarters
|
|

23
Johnson & Johnson
JNJ
$683B
| $122M | 1.36% |
1,002,162
+14,222
| +1% | +$1.77M |
2013 Q2
20 quarters
|
|
|
24
Jones Lang LaSalle
JLL
$16.7B
| $121M | 1.36% |
730,113
-254,717
| -26% | -$43.3M |
2013 Q2
20 quarters
|
|

25
MSG Knickerbockers Corp.
MSGK
$7.61B
| $115M | 1.29% |
521,244
-3,851
| -0.7% | -$712K |
2013 Q2
20 quarters
|
|
Similar funds






John Rogers's Q2 2018 Portfolio in Review
As of Q2 2018, John Rogers held 168 positions worth $8.91B, up 1.7% from $8.76B the previous quarter. Its ten largest holdings account for 25% of the portfolio.
John Rogers's Q2 2018 filing shows 3 new, 71 increased, 82 reduced and 8 closed positions. Its largest new stake was Lakeland Industries: 474,799 shares worth $6.72M. The largest sale was Jones Lang LaSalle, an estimated $43.3M.
By sector, the portfolio is most concentrated in Financials at 21% of assets, down from 22% a quarter earlier, followed by Communication Services and Industrials.
- John Rogers's largest Q2 2018 buy was Lakeland Industries: 474,799 shares worth $6.72M.
- John Rogers added most to Philip Morris in Q2 2018, an estimated $95.9M increase.
- John Rogers's biggest Q2 2018 reduction was Jones Lang LaSalle, cutting an estimated $43.3M.
- John Rogers fully exited T. Rowe Price in Q2 2018, selling an estimated $22.3M.
- John Rogers's ten largest holdings make up 25% of its $8.91B portfolio in Q2 2018.
- John Rogers opened 3 new positions and closed 8 in Q2 2018.
- John Rogers's portfolio value rose 1.7% quarter-over-quarter to $8.91B.
Based on Ariel Investments's 13F filing for Q2 2018, filed 10 Aug 2018.