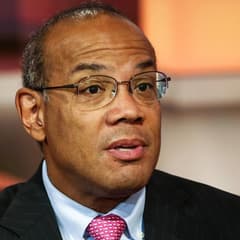
John Rogers Ariel Investments
John W. Rogers Jr. is the founder of Ariel Investments, one of the best-known minority-owned investment firms in the United States. Ariel is associated with patient, value-oriented investing and a long-term “slow and steady” culture. Rogers is also a prominent voice on markets, corporate leadership, and inclusive capitalism.
Top Buys
| Rank | Stock | Value |
|---|---|---|
| 1 |

Mattel
MAT
|
+$42.2M |
| 2 |

J.M. Smucker
SJM
|
+$36.5M |
| 3 |
MSGN
MSG Networks Inc.
MSGN
|
+$32.3M |
| 4 |

U.S. SILICA HOLDINGS, INC.
SLCA
|
+$29.9M |
| 5 |

Pioneer Natural Resource Co.
PXD
|
+$21.8M |
Top Sells
| Rank | Stock | Value |
|---|---|---|
| 1 |
VIAB
Viacom Inc. Class B
VIAB
|
+$39.9M |
| 2 |

Charles River Laboratories
CRL
|
+$27.8M |
| 3 |

Baidu
BIDU
|
+$23.3M |
| 4 |

CBRE Group
CBRE
|
+$21.4M |
| 5 |

Labcorp
LH
|
+$21.2M |
Sector Composition
| Rank | Sector | Weight |
|---|---|---|
| 1 | Financials | 22.97% |
| 2 | Communication Services | 13.85% |
| 3 | Healthcare | 13.69% |
| 4 | Technology | 13.64% |
| 5 | Industrials | 13.44% |
| Name | Market Value | Portfolio Weight | Shares or Principal |
Change in Stake | Capital Flow | Held Since | |
|---|---|---|---|---|---|---|---|
|
1
Baidu
BIDU
$27.4B
| $270M | 3.14% |
1,091,778
-106,709
| -9% | -$23.3M |
2013 Q2
17 quarters
|
|

2
First American
FAF
$6.63B
| $261M | 3.02% |
5,213,571
-40,472
| -0.8% | -$1.93M |
2013 Q2
17 quarters
|
|

3
Lazard
LAZ
$3.74B
| $248M | 2.87% |
5,473,715
-45,847
| -0.8% | -$2.03M |
2013 Q2
17 quarters
|
|

4
Kennametal
KMT
$2.33B
| $221M | 2.57% |
5,489,586
+5,510
| +0.1% | +$204K |
2014 Q2
13 quarters
|
|

5
Microsoft
MSFT
$4.13T
| $204M | 2.36% |
2,734,536
+119,822
| +5% | +$8.75M |
2013 Q2
17 quarters
|
|

6
Nokia
NOK
$46.2B
| $196M | 2.28% |
32,811,545
-291,263
| -0.9% | -$1.81M |
2013 Q2
17 quarters
|
|

7
Keysight
KEYS
$48.7B
| $195M | 2.26% |
4,673,259
+6,279
| +0.1% | +$257K |
2016 Q4
3 quarters
|
|
|
8
Labcorp
LH
$28.7B
| $188M | 2.19% |
1,452,658
-159,268
| -10% | -$21.2M |
2014 Q1
14 quarters
|
|
|
9
Charles River Laboratories
CRL
$15.6B
| $181M | 2.11% |
1,680,066
-270,301
| -14% | -$27.8M |
2013 Q2
17 quarters
|
|

10
Gilead Sciences
GILD
$216B
| $176M | 2.04% |
2,169,437
+78,624
| +4% | +$6.01M |
2013 Q2
17 quarters
|
|

11
Northern Trust
NTRS
$31.3B
| $175M | 2.04% |
1,908,175
-3,531
| -0.2% | -$319K |
2013 Q2
17 quarters
|
|

12
Zebra Technologies
ZBRA
$15.7B
| $173M | 2.01% |
1,597,152
-135,233
| -8% | -$13.9M |
2013 Q4
15 quarters
|
|

13
KKR & Co
KKR
$91B
| $172M | 2% |
8,477,064
-126,811
| -1% | -$2.41M |
2013 Q2
17 quarters
|
|
|
MSGN
14
DELISTED
MSG Networks Inc.
MSGN
| $162M | 1.88% |
7,642,286
+1,520,233
| +25% | +$32.3M |
2015 Q4
7 quarters
|
|

15
DELISTED
Interpublic Group of Companies
IPG
| $160M | 1.86% |
7,701,574
+237,039
| +3% | +$5.16M |
2013 Q2
17 quarters
|
|

16
Jones Lang LaSalle
JLL
$17.1B
| $158M | 1.83% |
1,276,857
-83,426
| -6% | -$10.3M |
2013 Q2
17 quarters
|
|
|
17
DELISTED
U.S. SILICA HOLDINGS, INC.
SLCA
| $149M | 1.72% |
4,780,845
+1,033,256
| +28% | +$29.9M |
2013 Q3
16 quarters
|
|
|
18
J.M. Smucker
SJM
$13.7B
| $142M | 1.65% |
1,356,718
+319,223
| +31% | +$36.5M |
2013 Q2
17 quarters
|
|
|
19
Mattel
MAT
$4.45B
| $129M | 1.49% |
8,313,633
+2,360,853
| +40% | +$42.2M |
2015 Q2
9 quarters
|
|

20
Aflac
AFL
$62.8B
| $129M | 1.49% |
3,161,186
-14,420
| -0.5% | -$581K |
2013 Q2
17 quarters
|
|

21
Johnson & Johnson
JNJ
$665B
| $129M | 1.49% |
989,289
+38,915
| +4% | +$5.16M |
2013 Q2
17 quarters
|
|

22
Zimmer Biomet
ZBH
$21B
| $124M | 1.44% |
1,089,187
-4,726
| -0.4% | -$546K |
2013 Q2
17 quarters
|
|

23
Bio-Rad Laboratories Class A
BIO
$10B
| $116M | 1.35% |
524,244
-49,993
| -9% | -$11.3M |
2013 Q2
17 quarters
|
|

24
Snap-on
SNA
$18.7B
| $114M | 1.32% |
764,034
+125,548
| +20% | +$18.9M |
2013 Q2
17 quarters
|
|
|
25
CBRE Group
CBRE
$39.1B
| $109M | 1.26% |
2,872,129
-582,385
| -17% | -$21.4M |
2013 Q2
17 quarters
|
|
Similar funds






John Rogers's Q3 2017 Portfolio in Review
As of Q3 2017, John Rogers held 188 positions worth $8.61B, up 1.9% from $8.46B the previous quarter. Its ten largest holdings account for 25% of the portfolio.
John Rogers's Q3 2017 filing shows 4 new, 96 increased, 71 reduced and 12 closed positions. Its largest new stake was Pioneer Natural Resource Co.: 151,931 shares worth $22.4M. The largest sale was Viacom Inc. Class B, an estimated $39.9M.
By sector, the portfolio is most concentrated in Financials at 23% of assets, up from 23% a quarter earlier, followed by Communication Services and Healthcare.
- John Rogers's largest Q3 2017 buy was Pioneer Natural Resource Co.: 151,931 shares worth $22.4M.
- John Rogers added most to Mattel in Q3 2017, an estimated $42.2M increase.
- John Rogers's biggest Q3 2017 reduction was Viacom Inc. Class B, cutting an estimated $39.9M.
- John Rogers fully exited West Marine Inc in Q3 2017, selling an estimated $7.6M.
- John Rogers's ten largest holdings make up 25% of its $8.61B portfolio in Q3 2017.
- John Rogers opened 4 new positions and closed 12 in Q3 2017.
- John Rogers's portfolio value rose 1.9% quarter-over-quarter to $8.61B.
Based on Ariel Investments's 13F filing for Q3 2017, filed 14 Nov 2017.