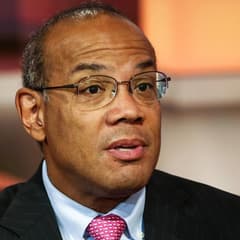
John Rogers Ariel Investments
John W. Rogers Jr. is the founder of Ariel Investments, one of the best-known minority-owned investment firms in the United States. Ariel is associated with patient, value-oriented investing and a long-term “slow and steady” culture. Rogers is also a prominent voice on markets, corporate leadership, and inclusive capitalism.
Top Buys
| Rank | Stock | Value |
|---|---|---|
| 1 |
MSGN
MSG Networks
MSGN
|
+$68.3M |
| 2 |

Zebra Technologies
ZBRA
|
+$42.9M |
| 3 |
BRS
Bristow Group
BRS
|
+$30.5M |
| 4 |

Kennametal
KMT
|
+$25.6M |
| 5 |

Nordstrom
JWN
|
+$21.5M |
Top Sells
| Rank | Stock | Value |
|---|---|---|
| 1 |

MSG Knickerbockers
MSGK
|
+$185M |
| 2 |

Newell Brands
NWL
|
+$86M |
| 3 |
BID
Sotheby's
BID
|
+$30.3M |
| 4 |

First American
FAF
|
+$30.2M |
| 5 |

Western Union
WU
|
+$28.1M |
Sector Composition
| Rank | Sector | Weight |
|---|---|---|
| 1 | Financials | 19.44% |
| 2 | Industrials | 18.05% |
| 3 | Communication Services | 15.68% |
| 4 | Healthcare | 14.12% |
| 5 | Technology | 9.27% |
| Name | Market Value | Portfolio Weight | Shares or Principal |
Change in Stake | Capital Flow | Held Since | |
|---|---|---|---|---|---|---|---|

1
Lazard
LAZ
$4.28B
| $249M | 2.99% |
5,540,072
+24,455
| +0.4% | +$1.12M |
2013 Q2
10 quarters
|
|
|
2
First American
FAF
$6.7B
| $221M | 2.64% |
6,144,140
-790,195
| -11% | -$30.2M |
2013 Q2
10 quarters
|
|

3
J.M. Smucker
SJM
$14.4B
| $219M | 2.62% |
1,773,704
-161,193
| -8% | -$19.2M |
2013 Q2
10 quarters
|
|

4
DELISTED
Interpublic Group of Companies
IPG
| $216M | 2.58% |
9,260,912
-973,510
| -10% | -$21.9M |
2013 Q2
10 quarters
|
|

5
Labcorp
LH
$30.1B
| $207M | 2.48% |
1,950,110
+55,792
| +3% | +$5.76M |
2014 Q1
7 quarters
|
|
|
BRS
6
DELISTED
Bristow Group
BRS
| $205M | 2.46% |
7,905,737
+1,012,643
| +15% | +$30.5M |
2013 Q2
10 quarters
|
|
|
7
Kennametal
KMT
$1.73B
| $204M | 2.44% |
10,602,518
+989,995
| +10% | +$25.6M |
2014 Q2
6 quarters
|
|
|
AXE
8
DELISTED
Anixter International
AXE
| $195M | 2.34% |
3,226,735
+100,549
| +3% | +$6.43M |
2013 Q2
10 quarters
|
|

9
Jones Lang LaSalle
JLL
$16.5B
| $181M | 2.18% |
1,134,989
-45,949
| -4% | -$7.27M |
2013 Q2
10 quarters
|
|
|
ISCA
10
DELISTED
International Speedway
ISCA
| $179M | 2.15% |
5,315,653
-499,689
| -9% | -$17.4M |
2013 Q2
10 quarters
|
|

11
DELISTED
TEGNA Inc
TGNA
| $170M | 2.04% |
10,428,992
+191,259
| +2% | +$3.23M |
2013 Q2
10 quarters
|
|
|
12
Western Union
WU
$1.93B
| $162M | 1.94% |
9,049,561
-1,487,840
| -14% | -$28.1M |
2013 Q2
10 quarters
|
|

13
Mattel
MAT
$4.25B
| $159M | 1.91% |
5,863,365
+31,080
| +0.5% | +$765K |
2015 Q2
2 quarters
|
|

14
Baidu
BIDU
$23.8B
| $153M | 1.83% |
806,996
+42,197
| +6% | +$7.78M |
2013 Q2
10 quarters
|
|

15
Stanley Black & Decker
SWK
$16.5B
| $144M | 1.72% |
1,346,214
-140,168
| -9% | -$14.8M |
2013 Q2
10 quarters
|
|

16
Charles River Laboratories
CRL
$16B
| $140M | 1.68% |
1,742,890
+68,560
| +4% | +$4.94M |
2013 Q2
10 quarters
|
|

17
Bio-Rad Laboratories Class A
BIO
$9.9B
| $139M | 1.67% |
1,005,947
+5,786
| +0.6% | +$802K |
2013 Q2
10 quarters
|
|

18
Microsoft
MSFT
$3.76T
| $137M | 1.65% |
2,475,332
-21,820
| -0.9% | -$1.15M |
2013 Q2
10 quarters
|
|

19
Zimmer Biomet
ZBH
$19.6B
| $137M | 1.64% |
1,375,559
+72,694
| +6% | +$7.11M |
2013 Q2
10 quarters
|
|

20
Snap-on
SNA
$18.9B
| $136M | 1.63% |
790,654
-30,480
| -4% | -$5.07M |
2013 Q2
10 quarters
|
|

21
Gilead Sciences
GILD
$210B
| $133M | 1.59% |
1,313,500
| – | – |
2013 Q2
10 quarters
|
|

22
KKR & Co
KKR
$84.2B
| $129M | 1.55% |
8,268,522
+1,073,935
| +15% | +$18.4M |
2013 Q2
10 quarters
|
|

23
Aflac
AFL
$62.4B
| $126M | 1.52% |
4,221,878
-125,740
| -3% | -$3.91M |
2013 Q2
10 quarters
|
|

24
Northern Trust
NTRS
$31.2B
| $116M | 1.39% |
1,602,589
+9,396
| +0.6% | +$675K |
2013 Q2
10 quarters
|
|

25
Brady
BRC
$3.5B
| $114M | 1.37% |
4,956,917
+5,020
| +0.1% | +$117K |
2013 Q2
10 quarters
|
|
Similar funds







John Rogers's Q4 2015 Portfolio in Review
As of Q4 2015, John Rogers held 200 positions worth $8.34B, up 3.8% from $8.03B the previous quarter. Its ten largest holdings account for 25% of the portfolio.
John Rogers's Q4 2015 filing shows 13 new, 80 increased, 92 reduced and 4 closed positions. Its largest new stake was MSG Networks: 3,355,502 shares worth $69.8M. The largest sale was MSG Knickerbockers, an estimated $185M.
By sector, the portfolio is most concentrated in Financials at 19% of assets, down from 21% a quarter earlier, followed by Industrials and Communication Services.
- John Rogers's largest Q4 2015 buy was MSG Networks: 3,355,502 shares worth $69.8M.
- John Rogers added most to Zebra Technologies in Q4 2015, an estimated $42.9M increase.
- John Rogers's biggest Q4 2015 reduction was MSG Knickerbockers, cutting an estimated $185M.
- John Rogers fully exited HCC Insurance Holdings in Q4 2015, selling an estimated $13M.
- John Rogers's ten largest holdings make up 25% of its $8.34B portfolio in Q4 2015.
- John Rogers opened 13 new positions and closed 4 in Q4 2015.
- John Rogers's portfolio value rose 3.8% quarter-over-quarter to $8.34B.
Based on Ariel Investments's 13F filing for Q4 2015, filed 12 Feb 2016.