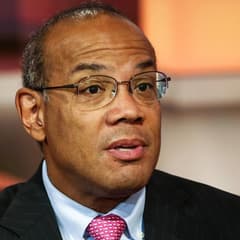
John Rogers Ariel Investments
John W. Rogers Jr. is the founder of Ariel Investments, one of the best-known minority-owned investment firms in the United States. Ariel is associated with patient, value-oriented investing and a long-term “slow and steady” culture. Rogers is also a prominent voice on markets, corporate leadership, and inclusive capitalism.
Top Buys
| Rank | Stock | Value |
|---|---|---|
| 1 |

U.S. Silica Holdings
SLCA
|
+$83.8M |
| 2 |

Kennametal
KMT
|
+$49.4M |
| 3 |

NOV
NOV
|
+$40.8M |
| 4 |

Vanguard FTSE Developed Markets ETF
VEA
|
+$33M |
| 5 |

Paramount Global Class B
PARA
|
+$21.5M |
Top Sells
| Rank | Stock | Value |
|---|---|---|
| 1 |
BYI
Bally Technologies
BYI
|
+$22.9M |
| 2 |

MSG Knickerbockers
MSGK
|
+$21.5M |
| 3 |

Nordstrom
JWN
|
+$20.9M |
| 4 |

First American
FAF
|
+$20.8M |
| 5 |

Fair Isaac
FICO
|
+$20.1M |
Sector Composition
| Rank | Sector | Weight |
|---|---|---|
| 1 | Financials | 23.04% |
| 2 | Industrials | 19.62% |
| 3 | Healthcare | 12.86% |
| 4 | Communication Services | 11.83% |
| 5 | Technology | 8.44% |
| Name | Market Value | Portfolio Weight | Shares or Principal |
Change in Stake | Capital Flow | Held Since | |
|---|---|---|---|---|---|---|---|
|
1
First American
FAF
$6.69B
| $329M | 3.8% |
9,716,218
-678,965
| -7% | -$20.8M |
2013 Q2
6 quarters
|
|
|
BRS
2
DELISTED
Bristow Group
BRS
| $278M | 3.21% |
4,222,916
+148,761
| +4% | +$10.1M |
2013 Q2
6 quarters
|
|

3
Western Union
WU
$1.96B
| $250M | 2.88% |
13,937,811
+288,215
| +2% | +$5M |
2013 Q2
6 quarters
|
|

4
Lazard
LAZ
$4.22B
| $247M | 2.85% |
4,928,720
+76,710
| +2% | +$3.8M |
2013 Q2
6 quarters
|
|

5
Jones Lang LaSalle
JLL
$16.5B
| $237M | 2.74% |
1,582,928
-143,451
| -8% | -$19.8M |
2013 Q2
6 quarters
|
|
|
ISCA
6
DELISTED
International Speedway
ISCA
| $203M | 2.34% |
6,415,666
+96,988
| +2% | +$3.01M |
2013 Q2
6 quarters
|
|

7
DELISTED
Interpublic Group of Companies
IPG
| $203M | 2.34% |
9,752,565
+291,105
| +3% | +$5.6M |
2013 Q2
6 quarters
|
|

8
J.M. Smucker
SJM
$14.3B
| $191M | 2.21% |
1,895,126
+81,650
| +5% | +$8.27M |
2013 Q2
6 quarters
|
|

9
DELISTED
TEGNA Inc
TGNA
| $190M | 2.19% |
11,377,793
-223,049
| -2% | -$3.59M |
2013 Q2
6 quarters
|
|
|
10
Kennametal
KMT
$1.79B
| $187M | 2.16% |
5,234,340
+1,295,685
| +33% | +$49.4M |
2014 Q2
2 quarters
|
|

11
DELISTED
City National
CYN
| $162M | 1.87% |
2,006,554
-4,406
| -0.2% | -$340K |
2013 Q2
6 quarters
|
|

12
Stanley Black & Decker
SWK
$16.3B
| $159M | 1.83% |
1,650,591
+162,335
| +11% | +$15M |
2013 Q2
6 quarters
|
|
|
JNS
13
DELISTED
Janus Capital Group
JNS
| $154M | 1.78% |
9,576,506
-457,275
| -5% | -$6.87M |
2013 Q2
6 quarters
|
|

14
Labcorp
LH
$30B
| $150M | 1.73% |
1,614,096
-3,240
| -0.2% | -$286K |
2014 Q1
3 quarters
|
|

15
Newell Brands
NWL
$2.45B
| $144M | 1.66% |
3,770,059
-6,860
| -0.2% | -$242K |
2013 Q2
6 quarters
|
|

16
KKR & Co
KKR
$84.6B
| $142M | 1.64% |
6,121,560
+159,240
| +3% | +$3.49M |
2013 Q2
6 quarters
|
|
|
HSP
17
DELISTED
Hospira
HSP
| $142M | 1.63% |
2,311,309
-122,060
| -5% | -$6.89M |
2013 Q2
6 quarters
|
|

18
CBRE Group
CBRE
$37.9B
| $131M | 1.52% |
3,835,896
-163,040
| -4% | -$5.22M |
2013 Q2
6 quarters
|
|

19
Snap-on
SNA
$18.7B
| $130M | 1.5% |
950,457
-81,750
| -8% | -$10.7M |
2013 Q2
6 quarters
|
|

20
Bio-Rad Laboratories Class A
BIO
$9.6B
| $128M | 1.48% |
1,060,567
-6,659
| -0.6% | -$766K |
2013 Q2
6 quarters
|
|

21
Charles River Laboratories
CRL
$16B
| $128M | 1.47% |
2,004,055
+7,785
| +0.4% | +$488K |
2013 Q2
6 quarters
|
|
|
BID
22
DELISTED
Sotheby's
BID
| $123M | 1.42% |
2,848,565
+156,290
| +6% | +$6.17M |
2013 Q2
6 quarters
|
|

23
Brady
BRC
$3.53B
| $122M | 1.41% |
4,462,578
+134,120
| +3% | +$3.26M |
2013 Q2
6 quarters
|
|

24
Zimmer Biomet
ZBH
$19.6B
| $118M | 1.36% |
1,072,194
-6,585
| -0.6% | -$694K |
2013 Q2
6 quarters
|
|
|
25
MSG Knickerbockers
MSGK
$7.56B
| $118M | 1.36% |
2,195,036
-426,504
| -16% | -$21.5M |
2013 Q2
6 quarters
|
|
Similar funds







John Rogers's Q4 2014 Portfolio in Review
As of Q4 2014, John Rogers held 196 positions worth $8.66B, up 12% from $7.75B the previous quarter. Its ten largest holdings account for 27% of the portfolio.
John Rogers deployed $366M of net new capital in Q4 2014, opening 10 new positions and adding to 95 existing holdings. Its largest new stake was LL Flooring Holdings: 357,204 shares worth $23.7M.
By sector, the portfolio is most concentrated in Financials at 23% of assets, down from 23% a quarter earlier, followed by Industrials and Healthcare.
On the sell side, the largest reduction was MSG Knickerbockers, an estimated $21.5M trimmed.
- John Rogers's largest Q4 2014 buy was LL Flooring Holdings: 357,204 shares worth $23.7M.
- John Rogers added most to U.S. Silica Holdings in Q4 2014, an estimated $83.8M increase.
- John Rogers's biggest Q4 2014 reduction was MSG Knickerbockers, cutting an estimated $21.5M.
- John Rogers fully exited Bally Technologies in Q4 2014, selling an estimated $22.9M.
- John Rogers's ten largest holdings make up 27% of its $8.66B portfolio in Q4 2014.
- John Rogers opened 10 new positions and closed 6 in Q4 2014.
- John Rogers's portfolio value rose 12% quarter-over-quarter to $8.66B.
Based on Ariel Investments's 13F filing for Q4 2014, filed 13 Feb 2015.