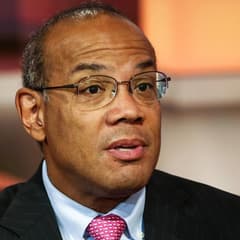
John Rogers Ariel Investments
John W. Rogers Jr. is the founder of Ariel Investments, one of the best-known minority-owned investment firms in the United States. Ariel is associated with patient, value-oriented investing and a long-term “slow and steady” culture. Rogers is also a prominent voice on markets, corporate leadership, and inclusive capitalism.
Top Buys
| Rank | Stock | Value |
|---|---|---|
| 1 |

Kennametal
KMT
|
+$100M |
| 2 |
AXE
Anixter International
AXE
|
+$80.2M |
| 3 |
BLT
Blount International
BLT
|
+$78.8M |
| 4 |

Lazard
LAZ
|
+$44.7M |
| 5 |

NOV
NOV
|
+$32.5M |
Top Sells
| Rank | Stock | Value |
|---|---|---|
| 1 |

City National
CYN
|
+$162M |
| 2 |
HSP
Hospira
HSP
|
+$142M |
| 3 |

First American
FAF
|
+$70M |
| 4 |

Fair Isaac
FICO
|
+$35.2M |
| 5 |

Western Union
WU
|
+$31.2M |
Sector Composition
| Rank | Sector | Weight |
|---|---|---|
| 1 | Financials | 21.05% |
| 2 | Industrials | 20.95% |
| 3 | Communication Services | 12.58% |
| 4 | Healthcare | 12.18% |
| 5 | Technology | 8.62% |
| Name | Market Value | Portfolio Weight | Shares or Principal |
Change in Stake | Capital Flow | Held Since | |
|---|---|---|---|---|---|---|---|
|
1
Lazard
LAZ
$3.82B
| $307M | 3.44% |
5,836,442
+907,722
| +18% | +$44.7M |
2013 Q2
7 quarters
|
|
|
2
Kennametal
KMT
$1.64B
| $276M | 3.09% |
8,193,593
+2,959,253
| +57% | +$100M |
2014 Q2
3 quarters
|
|
|
3
First American
FAF
$6.59B
| $275M | 3.08% |
7,703,312
-2,012,906
| -21% | -$70M |
2013 Q2
7 quarters
|
|
|
BRS
4
DELISTED
Bristow Group
BRS
| $259M | 2.9% |
4,749,344
+526,428
| +12% | +$31.1M |
2013 Q2
7 quarters
|
|
|
5
Western Union
WU
$1.85B
| $255M | 2.86% |
12,264,707
-1,673,104
| -12% | -$31.2M |
2013 Q2
7 quarters
|
|

6
Jones Lang LaSalle
JLL
$15.8B
| $246M | 2.75% |
1,442,198
-140,730
| -9% | -$22.2M |
2013 Q2
7 quarters
|
|

7
J.M. Smucker
SJM
$14.3B
| $221M | 2.48% |
1,912,771
+17,645
| +0.9% | +$1.93M |
2013 Q2
7 quarters
|
|
|
ISCA
8
DELISTED
International Speedway
ISCA
| $220M | 2.47% |
6,757,794
+342,128
| +5% | +$10.7M |
2013 Q2
7 quarters
|
|

9
DELISTED
Interpublic Group of Companies
IPG
| $207M | 2.32% |
9,353,307
-399,258
| -4% | -$8.47M |
2013 Q2
7 quarters
|
|

10
DELISTED
TEGNA Inc
TGNA
| $199M | 2.23% |
10,253,685
-1,124,108
| -10% | -$19.8M |
2013 Q2
7 quarters
|
|

11
Labcorp
LH
$29.8B
| $177M | 1.99% |
1,635,190
+21,094
| +1% | +$2.17M |
2014 Q1
4 quarters
|
|
|
AXE
12
DELISTED
Anixter International
AXE
| $170M | 1.9% |
2,231,671
+1,027,795
| +85% | +$80.2M |
2013 Q2
7 quarters
|
|

13
Stanley Black & Decker
SWK
$15.9B
| $160M | 1.79% |
1,678,617
+28,026
| +2% | +$2.68M |
2013 Q2
7 quarters
|
|

14
Bio-Rad Laboratories Class A
BIO
$9.7B
| $154M | 1.73% |
1,141,142
+80,575
| +8% | +$10M |
2013 Q2
7 quarters
|
|

15
Newell Brands
NWL
$2.26B
| $148M | 1.66% |
3,797,991
+27,932
| +0.7% | +$1.08M |
2013 Q2
7 quarters
|
|

16
CBRE Group
CBRE
$36.5B
| $145M | 1.63% |
3,752,492
-83,404
| -2% | -$2.88M |
2013 Q2
7 quarters
|
|

17
KKR & Co
KKR
$79B
| $143M | 1.6% |
6,249,442
+127,882
| +2% | +$3.02M |
2013 Q2
7 quarters
|
|

18
Charles River Laboratories
CRL
$15.1B
| $139M | 1.56% |
1,758,445
-245,610
| -12% | -$18.1M |
2013 Q2
7 quarters
|
|

19
Snap-on
SNA
$18B
| $137M | 1.53% |
931,098
-19,359
| -2% | -$2.72M |
2013 Q2
7 quarters
|
|
|
JNS
20
DELISTED
Janus Capital Group
JNS
| $135M | 1.51% |
7,858,859
-1,717,647
| -18% | -$29.3M |
2013 Q2
7 quarters
|
|

21
Brady
BRC
$3.35B
| $134M | 1.51% |
4,751,462
+288,884
| +6% | +$7.86M |
2013 Q2
7 quarters
|
|

22
MSG Knickerbockers
MSGK
$7.32B
| $132M | 1.48% |
2,194,190
-846
| -0% | -$46.5K |
2013 Q2
7 quarters
|
|

23
Zimmer Biomet
ZBH
$19.1B
| $125M | 1.4% |
1,092,216
+20,022
| +2% | +$2.28M |
2013 Q2
7 quarters
|
|

24
Aflac
AFL
$61.5B
| $124M | 1.39% |
3,863,808
+584,884
| +18% | +$17.8M |
2013 Q2
7 quarters
|
|

25
Simpson Manufacturing
SSD
$7.63B
| $120M | 1.34% |
3,204,540
+25,669
| +0.8% | +$902K |
2013 Q2
7 quarters
|
|
Similar funds







John Rogers's Q1 2015 Portfolio in Review
As of Q1 2015, John Rogers held 194 positions worth $8.92B, up 3% from $8.66B the previous quarter. Its ten largest holdings account for 28% of the portfolio.
John Rogers's Q1 2015 filing shows 4 new, 121 increased, 55 reduced and 7 closed positions. Its largest new stake was SeaChange International: 64,087 shares worth $10.1M. The largest sale was City National, an estimated $162M.
By sector, the portfolio is most concentrated in Financials at 21% of assets, down from 23% a quarter earlier, followed by Industrials and Communication Services.
- John Rogers's largest Q1 2015 buy was SeaChange International: 64,087 shares worth $10.1M.
- John Rogers added most to Kennametal in Q1 2015, an estimated $100M increase.
- John Rogers's biggest Q1 2015 reduction was First American, cutting an estimated $70M.
- John Rogers fully exited City National in Q1 2015, selling an estimated $162M.
- John Rogers's ten largest holdings make up 28% of its $8.92B portfolio in Q1 2015.
- John Rogers opened 4 new positions and closed 7 in Q1 2015.
- John Rogers's portfolio value rose 3% quarter-over-quarter to $8.92B.
Based on Ariel Investments's 13F filing for Q1 2015, filed 14 May 2015.