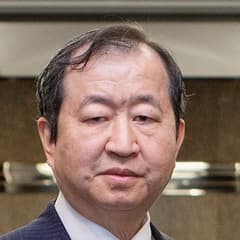
Francis Chou Chou Associates Management
Francis Chou is the founder of Chou Associates Management and a Canadian value investor known for deep-value and special-situation securities. His funds have historically owned a mix of equities and distressed or complex instruments when prices offered a margin of safety. Chou’s annual reports are read for candid discussion of mistakes, opportunities, and long-term results.
Top-Käufe
| Rang | Aktie | Wert |
|---|---|---|
| 1 |

Vitesse Energy
VTS
|
+22.891 $ |
Größte Verkäufe
| Rang | Aktie | Wert |
|---|---|---|
| 1 |

Apple
AAPL
|
+1,14 Mio. $ |
Sektoraufteilung
| Rang | Sektor | Gewichtung |
|---|---|---|
| 1 | Finanzwesen | 58,56 % |
| 2 | Kommunikationsdienste | 17,4 % |
| 3 | Nicht-Basiskonsumgüter | 8,22 % |
| 4 | Energie | 7,29 % |
| 5 | Technologie | 5,61 % |
| Name | Marktwert | Portfolioanteil | Aktien oder Kapitalbetrag |
Änderung der Beteiligung | Kapitalfluss | Im Bestand seit | |
|---|---|---|---|---|---|---|---|

1
Berkshire Hathaway Class A
BRK.A
1,14 Bio. $
| 64,4 Mio. $ | 29,73 % |
86
| – | – |
2013 Q2
52 Quartale
|
|

2
Alphabet (Google) Class C
GOOG
4,12 Bio. $
| 25,6 Mio. $ | 11,81 % |
72.390
| – | – |
2024 Q2
8 Quartale
|
|

3
Synchrony
SYF
24 Mrd. $
| 17 Mio. $ | 7,84 % |
223.202
| – | – |
2022 Q4
14 Quartale
|
|

4
Occidental Petroleum
OXY
62,4 Mrd. $
| 15,2 Mio. $ | 7,02 % |
313.000
| – | – |
2025 Q1
5 Quartale
|
|

5
SiriusXM
SIRI
9,09 Mrd. $
| 12,1 Mio. $ | 5,59 % |
409.589
| – | – |
2024 Q3
7 Quartale
|
|
|
6
Apple
AAPL
5,01 Bio. $
| 11,6 Mio. $ | 5,34 % |
40.000
-4.000
| -9 % | -1,14 Mio. $ |
2024 Q2
8 Quartale
|
|

7
Ally Financial
ALLY
11,5 Mrd. $
| 10,4 Mio. $ | 4,78 % |
225.525
| – | – |
2022 Q4
14 Quartale
|
|

8
Stellantis
STLA
12,7 Mrd. $
| 8 Mio. $ | 3,69 % |
1.394.194
| – | – |
2018 Q4
30 Quartale
|
|

9
Jefferies Financial Group
JEF
10,3 Mrd. $
| 7,46 Mio. $ | 3,44 % |
149.237
| – | – |
2024 Q2
8 Quartale
|
|

10
PayPal
PYPL
48,5 Mrd. $
| 7,23 Mio. $ | 3,34 % |
167.400
| – | – |
2024 Q2
8 Quartale
|
|

11
Wells Fargo
WFC
252 Mrd. $
| 4,92 Mio. $ | 2,27 % |
59.542
| – | – |
2018 Q3
31 Quartale
|
|

12
Citigroup
C
208 Mrd. $
| 4,58 Mio. $ | 2,11 % |
32.695
| – | – |
2013 Q2
52 Quartale
|
|

13
Alibaba
BABA
271 Mrd. $
| 4,02 Mio. $ | 1,86 % |
41.900
| – | – |
2023 Q2
12 Quartale
|
|

14
General Motors
GM
73,7 Mrd. $
| 4,01 Mio. $ | 1,85 % |
52.000
| – | – |
2025 Q1
5 Quartale
|
|

15
Bank of America
BAC
358 Mrd. $
| 2,85 Mio. $ | 1,32 % |
50.000
| – | – |
2024 Q2
8 Quartale
|
|

16
Pathward Financial
CASH
1,52 Mrd. $
| 2,38 Mio. $ | 1,1 % |
27.389
| – | – |
2024 Q2
8 Quartale
|
|

17
Pool Corp
POOL
6,27 Mrd. $
| 2,29 Mio. $ | 1,06 % |
10.636
| – | – |
2024 Q2
8 Quartale
|
|

18
MBIA
MBI
225 Mio. $
| 2,09 Mio. $ | 0,97 % |
321.000
| – | – |
2024 Q2
8 Quartale
|
|

19
The Kraft Heinz Company
KHC
28,1 Mrd. $
| 1,64 Mio. $ | 0,76 % |
69.500
| – | – |
2026 Q1
1 Quartal
|
|

20
Berkshire Hathaway Class B
BRK.B
1,14 Bio. $
| 1,55 Mio. $ | 0,72 % |
3.100
| – | – |
2026 Q1
1 Quartal
|
|

21
Assured Guaranty
AGO
3,12 Mrd. $
| 1,36 Mio. $ | 0,63 % |
16.990
| – | – |
2024 Q2
8 Quartale
|
|

22
China Yuchai International
CYD
976 Mio. $
| 1,11 Mio. $ | 0,51 % |
23.364
| – | – |
2013 Q2
52 Quartale
|
|

23
Methanex
MEOH
5,03 Mrd. $
| 923.814 $ | 0,43 % |
20.000
| – | – |
2022 Q4
14 Quartale
|
|

24
Moody's
MCO
84 Mrd. $
| 679.380 $ | 0,31 % |
1.500
| – | – |
2024 Q2
8 Quartale
|
|

25
Magna International
MGA
17,7 Mrd. $
| 656.600 $ | 0,3 % |
10.000
| – | – |
2018 Q4
30 Quartale
|
|
Ähnliche Fonds
Portfolio-Rückblick von Francis Chou für Q2 2026
Zum Stand von Q2 2026 hielt Francis Chou 31 Positionen im Wert von 217 Mio. $, ein Anstieg um 3 % gegenüber 210 Mio. $ im Vorquartal. Die zehn größten Positionen machen 83 % des Portfolios aus.
Der Handel war in Q2 2026 verhalten: Die Portfolio-Umschlagshäufigkeit lag bei 3,2 %. Francis Chou hat eine neue Position eröffnet und keine Positionen geschlossen, sodass das Portfolio mit 31 Positionen weitgehend unverändert blieb.
Nach Sektoren betrachtet ist das Portfolio mit 59 % des verwalteten Vermögens am stärksten in Finanzwesen gewichtet, gegenüber 56 % im Vorquartal. Es folgen Kommunikationsdienste und Nicht-Basiskonsumgüter.
- Der größte Kauf von Francis Chou im Q2 2026 war Vitesse Energy: 1.293 Aktien im Wert von 20.391 $.
- Der größte Positionsabbau von Francis Chou im Q2 2026 entfiel auf Apple und belief sich schätzungsweise auf 1,14 Mio. $.
- Die zehn größten Positionen von Francis Chou machen im Q2 2026 83 % des Portfolios mit einem verwalteten Vermögen von 217 Mio. $ aus.
- Francis Chou hat in Q2 2026 eine neue Position eröffnet und 0 Positionen geschlossen.
- Der Portfoliowert von Francis Chou stieg gegenüber dem Vorquartal um 3 % auf 217 Mio. $.
Auf Grundlage der von Chou Associates Management für Q2 2026 am 12. Aug. 2026 eingereichten 13F-Meldung .