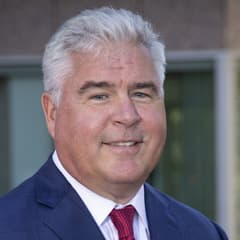
Steven Check Check Capital Management
Steven Check is the founder of Check Capital Management, a value-oriented firm known for research-driven equity portfolios and a long-term client focus. The firm often emphasizes understandable businesses purchased with a margin of safety. Check’s public commentary and portfolio disclosures appeal to investors who prefer classical value frameworks.
Top Buys
| Rank | Stock | Value |
|---|---|---|
| 1 |

Chipotle Mexican Grill
CMG
|
+$29.7M |
| 2 |

AutoNation
AN
|
+$23.4M |
| 3 |

Spectrum Brands
SPB
|
+$11.5M |
| 4 |

Fastenal
FAST
|
+$9.18M |
| 5 |

AutoZone
AZO
|
+$2.81M |
Top Sells
| Rank | Stock | Value |
|---|---|---|
| 1 |

Verizon
VZ
|
+$29.4M |
| 2 |

Travel + Leisure Co
TNL
|
+$8.53M |
| 3 |

CarMax
KMX
|
+$5.71M |
| 4 |

Berkshire Hathaway Class B
BRK.B
|
+$3.92M |
| 5 |

FedEx
FDX
|
+$3.34M |
Sector Composition
| Rank | Sector | Weight |
|---|---|---|
| 1 | Financials | 29.54% |
| 2 | Miscellaneous | 28.44% |
| 3 | Consumer Discretionary | 11.46% |
| 4 | Technology | 7.39% |
| 5 | Consumer Staples | 6.3% |
| Name | Market Value | Portfolio Weight | Shares or Principal |
Change in Stake | Capital Flow | Held Since | |
|---|---|---|---|---|---|---|---|
|
1
CALL
Berkshire Hathaway Class B
BRK.B
$1.22T
| $434M | 25.93% |
2,366,900
-12,300
| -0.5% | -$2.17M |
2013 Q2
17 quarters
|
|
|
2
Berkshire Hathaway Class B
BRK.B
$1.22T
| $319M | 19.04% |
1,737,980
-22,176
| -1% | -$3.92M |
2013 Q2
17 quarters
|
|

3
Wells Fargo
WFC
$253B
| $78M | 4.66% |
1,413,691
-23,782
| -2% | -$1.26M |
2013 Q2
17 quarters
|
|

4
Suncor Energy
SU
$80.4B
| $71.7M | 4.29% |
2,047,874
-43,652
| -2% | -$1.39M |
2014 Q1
14 quarters
|
|
|
5
FedEx
FDX
$72.8B
| $59.3M | 3.54% |
262,708
-15,665
| -6% | -$3.34M |
2015 Q4
7 quarters
|
|

6
Qualcomm
QCOM
$178B
| $57.8M | 3.45% |
1,115,265
-7,106
| -0.6% | -$376K |
2013 Q2
17 quarters
|
|

7
DELISTED
Hanesbrands
HBI
| $54.4M | 3.25% |
2,207,847
+1,278
| +0.1% | +$30.7K |
2016 Q3
4 quarters
|
|

8
Ingredion
INGR
$5.77B
| $51.7M | 3.09% |
428,909
-2,545
| -0.6% | -$310K |
2014 Q2
13 quarters
|
|

9
American Express
AXP
$217B
| $47.7M | 2.85% |
527,781
-3,817
| -0.7% | -$328K |
2014 Q4
11 quarters
|
|
|
ESRX
10
DELISTED
Express Scripts Holding Company
ESRX
| $45.4M | 2.71% |
717,004
+10,925
| +2% | +$679K |
2014 Q3
12 quarters
|
|

11
Berkshire Hathaway Class A
BRK.A
$1.23T
| $40.7M | 2.43% |
148
+2
| +1% | +$531K |
2013 Q2
17 quarters
|
|
|
12
Spectrum Brands
SPB
$1.99B
| $40.2M | 2.4% |
379,936
+102,536
| +37% | +$11.5M |
2015 Q4
7 quarters
|
|

13
Labcorp
LH
$29.6B
| $39.8M | 2.38% |
306,504
-7,424
| -2% | -$990K |
2016 Q1
6 quarters
|
|
|
14
AutoZone
AZO
$52.1B
| $36.8M | 2.2% |
61,921
+5,283
| +9% | +$2.81M |
2017 Q2
1 quarter
|
|

15
LKQ Corp
LKQ
$5.08B
| $35.7M | 2.13% |
992,313
+10,525
| +1% | +$359K |
2017 Q1
2 quarters
|
|

16
IBM
IBM
$232B
| $32.3M | 1.93% |
232,944
-9,281
| -4% | -$1.29M |
2013 Q2
17 quarters
|
|

17
Cognizant
CTSH
$28.8B
| $31.1M | 1.86% |
428,536
-37,796
| -8% | -$2.65M |
2017 Q1
2 quarters
|
|
|
18
Chipotle Mexican Grill
CMG
$43.8B
| $27.1M | 1.62% |
+4,407,650
| New | +$29.7M |
2017 Q3
0 quarters
|
|
|
19
AutoNation
AN
$5.89B
| $25.6M | 1.53% |
+539,750
| New | +$23.4M |
2017 Q3
0 quarters
|
|
|
20
Verizon
VZ
$189B
| $18.2M | 1.08% |
366,836
-624,084
| -63% | -$29.4M |
2014 Q1
14 quarters
|
|

21
Phillips 66
PSX
$97B
| $16.3M | 0.97% |
177,683
-1,490
| -0.8% | -$126K |
2016 Q1
6 quarters
|
|

22
Abbott
ABT
$192B
| $14.7M | 0.88% |
275,851
-31,701
| -10% | -$1.59M |
2013 Q2
17 quarters
|
|

23
AB InBev
BUD
$167B
| $13M | 0.77% |
108,710
+14,900
| +16% | +$1.74M |
2016 Q4
3 quarters
|
|
|
24
Fastenal
FAST
$60.8B
| $10.6M | 0.63% |
926,384
+852,400
| +1,152% | +$9.18M |
2014 Q3
12 quarters
|
|
|
25
CarMax
KMX
$7.3B
| $5.76M | 0.34% |
75,987
-85,655
| -53% | -$5.71M |
2016 Q4
3 quarters
|
|
Similar funds






Steven Check's Q3 2017 Portfolio in Review
As of Q3 2017, Steven Check held 61 positions worth $1.67B, up 6.7% from $1.57B the previous quarter. Its ten largest holdings account for 73% of the portfolio.
Steven Check's Q3 2017 filing shows 6 new, 14 increased, 28 reduced and 3 closed positions. Its largest new stake was Chipotle Mexican Grill: 4,407,650 shares worth $27.1M. The largest sale was Verizon, an estimated $29.4M.
By sector, the portfolio is most concentrated in Financials at 30% of assets, down from 30% a quarter earlier, followed by Miscellaneous and Consumer Discretionary.
- Steven Check's largest Q3 2017 buy was Chipotle Mexican Grill: 4,407,650 shares worth $27.1M.
- Steven Check added most to Spectrum Brands in Q3 2017, an estimated $11.5M increase.
- Steven Check's biggest Q3 2017 reduction was Verizon, cutting an estimated $29.4M.
- Steven Check fully exited Methode Electronics in Q3 2017, selling an estimated $612K.
- Steven Check's ten largest holdings make up 73% of its $1.67B portfolio in Q3 2017.
- Steven Check opened 6 new positions and closed 3 in Q3 2017.
- Steven Check's portfolio value rose 6.7% quarter-over-quarter to $1.67B.
Based on Check Capital Management's 13F filing for Q3 2017, filed 8 Nov 2017.