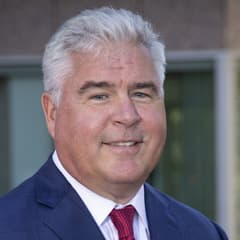
Steven Check Check Capital Management
Steven Check is the founder of Check Capital Management, a value-oriented firm known for research-driven equity portfolios and a long-term client focus. The firm often emphasizes understandable businesses purchased with a margin of safety. Check’s public commentary and portfolio disclosures appeal to investors who prefer classical value frameworks.
Top Buys
| Rank | Stock | Value |
|---|---|---|
| 1 |

First Citizens BancShares
FCNCA
|
+$11.8M |
| 2 |

Markel Group
MKL
|
+$4.74M |
| 3 |

Brookfield
BN
|
+$973K |
| 4 |

Uber
UBER
|
+$193K |
| 5 |

Bank of America
BAC
|
+$126K |
Top Sells
| Rank | Stock | Value |
|---|---|---|
| 1 |

Bread Financial
BFH
|
+$11.8M |
| 2 |

Alphabet (Google) Class C
GOOG
|
+$2.57M |
| 3 |

LKQ
LKQ
|
+$2.13M |
| 4 |

Suncor Energy
SU
|
+$1.63M |
| 5 |

FedEx
FDX
|
+$1.45M |
Sector Composition
| Rank | Sector | Weight |
|---|---|---|
| 1 | Miscellaneous | 53.81% |
| 2 | Financials | 29.34% |
| 3 | Consumer Discretionary | 5.35% |
| 4 | Industrials | 4.1% |
| 5 | Communication Services | 3.88% |
| Name | Market Value | Portfolio Weight | Shares or Principal |
Change in Stake | Capital Flow | Held Since | |
|---|---|---|---|---|---|---|---|

1
CALL
Berkshire Hathaway Class B
BRK.B
$1.21T
| $1.34B | 52.88% |
3,918,400
+190,900
| +5% | +$62.3M |
2013 Q2
40 quarters
|
|
|
2
Berkshire Hathaway Class B
BRK.B
$1.21T
| $464M | 18.36% |
1,360,222
-67
| -0% | -$21.9K |
2013 Q2
40 quarters
|
|
|
3
Brookfield
BN
$84B
| $101M | 4.01% |
4,519,085
+45,896
| +1% | +$973K |
2017 Q4
22 quarters
|
|
|
4
Markel Group
MKL
$23.7B
| $100M | 3.94% |
71,999
+3,532
| +5% | +$4.74M |
2014 Q2
36 quarters
|
|
|
5
Alphabet (Google) Class C
GOOG
$3.25T
| $94.3M | 3.73% |
779,965
-22,180
| -3% | -$2.57M |
2019 Q2
16 quarters
|
|
|
6
LKQ
LKQ
$4.67B
| $69.6M | 2.75% |
1,194,009
-38,361
| -3% | -$2.13M |
2017 Q1
25 quarters
|
|
|
7
Suncor Energy
SU
$73.5B
| $53.2M | 2.11% |
1,815,960
-54,479
| -3% | -$1.63M |
2014 Q1
37 quarters
|
|

8
AerCap
AER
$24.9B
| $53M | 2.1% |
833,810
-21,507
| -3% | -$1.24M |
2021 Q1
9 quarters
|
|

9
CarMax
KMX
$6.82B
| $52.1M | 2.06% |
622,824
-15,279
| -2% | -$1.12M |
2018 Q1
21 quarters
|
|
|
10
FedEx
FDX
$71.2B
| $49.3M | 1.95% |
198,859
-6,327
| -3% | -$1.45M |
2015 Q4
30 quarters
|
|

11
Wells Fargo
WFC
$236B
| $32.5M | 1.29% |
761,930
-19,292
| -2% | -$777K |
2013 Q2
40 quarters
|
|

12
Quest Diagnostics
DGX
$28.4B
| $25M | 0.99% |
178,086
-4,790
| -3% | -$660K |
2020 Q3
11 quarters
|
|

13
Berkshire Hathaway Class A
BRK.A
$1.21T
| $23.8M | 0.94% |
46
| – | – |
2013 Q2
40 quarters
|
|
|
14
First Citizens BancShares
FCNCA
$23B
| $13.1M | 0.52% |
+10,188
| New | +$11.8M |
2023 Q2
0 quarters
|
|

15
Wayfair
W
$13B
| $10.6M | 0.42% |
162,513
-18,358
| -10% | -$773K |
2020 Q2
12 quarters
|
|

16
Apple
AAPL
$4.98T
| $6.61M | 0.26% |
34,080
| – | – |
2013 Q2
40 quarters
|
|
|
17
Bank of America
BAC
$325B
| $4.53M | 0.18% |
157,886
+4,429
| +3% | +$126K |
2014 Q3
35 quarters
|
|

18
Walt Disney
DIS
$202B
| $3.26M | 0.13% |
36,469
-1,589
| -4% | -$151K |
2015 Q4
30 quarters
|
|

19
Biglari Holdings Class A
BH.A
$1.19B
| $2.22M | 0.09% |
2,342
-4
| -0.2% | -$3.7K |
2018 Q2
20 quarters
|
|

20
Microsoft
MSFT
$3.6T
| $1.98M | 0.08% |
5,804
-125
| -2% | -$39.2K |
2013 Q2
40 quarters
|
|

21
Brookfield Asset Management
BAM
$78.2B
| $1.83M | 0.07% |
55,935
-262
| -0.5% | -$8.43K |
2022 Q4
2 quarters
|
|

22
Amgen
AMGN
$236B
| $826K | 0.03% |
3,720
| – | – |
2015 Q1
33 quarters
|
|

23
iShares Future Exponential Technologies ETF
XT
$3.59B
| $467K | 0.02% |
8,400
| – | – |
2017 Q3
23 quarters
|
|

24
Caterpillar
CAT
$234B
| $422K | 0.02% |
1,717
| – | – |
2018 Q1
21 quarters
|
|

25
Tesla
TSLA
$1.37T
| $414K | 0.02% |
1,581
+78
| +5% | +$15.6K |
2023 Q1
1 quarter
|
|
Similar funds






Steven Check's Q2 2023 Portfolio in Review
As of Q2 2023, Steven Check held 42 positions worth $2.53B, up 13% from $2.24B the previous quarter. Its ten largest holdings account for 94% of the portfolio.
Steven Check's Q2 2023 filing shows 3 new, 7 increased, 17 reduced and 2 closed positions. Its largest new stake was First Citizens BancShares: 10,188 shares worth $13.1M. The largest sale was Bread Financial, an estimated $11.8M.
By sector, the portfolio is most concentrated in Miscellaneous at 54% of assets, up from 52% a quarter earlier, followed by Financials and Consumer Discretionary.
- Steven Check's largest Q2 2023 buy was First Citizens BancShares: 10,188 shares worth $13.1M.
- Steven Check added most to Markel Group in Q2 2023, an estimated $4.74M increase.
- Steven Check's biggest Q2 2023 reduction was Alphabet (Google) Class C, cutting an estimated $2.57M.
- Steven Check fully exited Bread Financial in Q2 2023, selling an estimated $11.8M.
- Steven Check's ten largest holdings make up 94% of its $2.53B portfolio in Q2 2023.
- Steven Check opened 3 new positions and closed 2 in Q2 2023.
- Steven Check's portfolio value rose 13% quarter-over-quarter to $2.53B.
Based on Check Capital Management's 13F filing for Q2 2023, filed 10 Aug 2023.