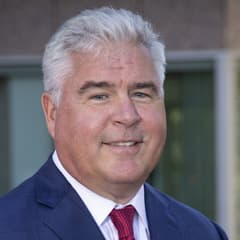
Steven Check Check Capital Management
Steven Check is the founder of Check Capital Management, a value-oriented firm known for research-driven equity portfolios and a long-term client focus. The firm often emphasizes understandable businesses purchased with a margin of safety. Check’s public commentary and portfolio disclosures appeal to investors who prefer classical value frameworks.
Top Buys
| Rank | Stock | Value |
|---|---|---|
| 1 |

Suncor Energy
SU
|
+$29.6M |
| 2 |

LKQ Corp
LKQ
|
+$29.4M |
| 3 |

Qualcomm
QCOM
|
+$27.7M |
| 4 |

Hanesbrands
HBI
|
+$18.2M |
| 5 |

Ingredion
INGR
|
+$16.9M |
Top Sells
| Rank | Stock | Value |
|---|---|---|
| 1 |

Berkshire Hathaway Class B
BRK.B
|
+$44.7M |
| 2 |

IBM
IBM
|
+$29.1M |
| 3 |

US Bancorp
USB
|
+$12.9M |
| 4 |

Aflac
AFL
|
+$11.8M |
| 5 |

Harley-Davidson
HOG
|
+$10.5M |
Sector Composition
| Rank | Sector | Weight |
|---|---|---|
| 1 | Financials | 28.72% |
| 2 | Miscellaneous | 28.34% |
| 3 | Consumer Discretionary | 8.66% |
| 4 | Technology | 7.62% |
| 5 | Consumer Staples | 6.97% |
| Name | Market Value | Portfolio Weight | Shares or Principal |
Change in Stake | Capital Flow | Held Since | |
|---|---|---|---|---|---|---|---|
|
1
CALL
Berkshire Hathaway Class B
BRK.B
$1.25T
| $381M | 26.09% |
2,286,000
+342,400
| +18% | +$57.3M |
2013 Q2
15 quarters
|
|
|
2
Berkshire Hathaway Class B
BRK.B
$1.25T
| $286M | 19.59% |
1,716,265
-266,923
| -13% | -$44.7M |
2013 Q2
15 quarters
|
|

3
Wells Fargo
WFC
$257B
| $79.6M | 5.45% |
1,429,737
-108,192
| -7% | -$6.14M |
2013 Q2
15 quarters
|
|
|
4
Suncor Energy
SU
$79.8B
| $63.7M | 4.36% |
2,070,330
+939,659
| +83% | +$29.6M |
2014 Q1
12 quarters
|
|
|
5
Qualcomm
QCOM
$190B
| $63.1M | 4.32% |
1,101,148
+477,514
| +77% | +$27.7M |
2013 Q2
15 quarters
|
|

6
FedEx
FDX
$74.8B
| $54.1M | 3.71% |
277,465
-38,964
| -12% | -$7.44M |
2015 Q4
5 quarters
|
|
|
7
Ingredion
INGR
$5.78B
| $51.5M | 3.53% |
427,562
+138,114
| +48% | +$16.9M |
2014 Q2
11 quarters
|
|

8
Verizon
VZ
$193B
| $49.6M | 3.4% |
1,017,533
-67,703
| -6% | -$3.4M |
2014 Q1
12 quarters
|
|
|
9
DELISTED
Hanesbrands
HBI
| $46.6M | 3.19% |
2,242,375
+856,541
| +62% | +$18.2M |
2016 Q3
2 quarters
|
|
|
ESRX
10
DELISTED
Express Scripts Holding Company
ESRX
| $44.5M | 3.05% |
674,989
+162,230
| +32% | +$11.2M |
2014 Q3
10 quarters
|
|

11
Travel + Leisure Co
TNL
$4.71B
| $40.6M | 2.78% |
1,067,931
+108,098
| +11% | +$3.97M |
2016 Q2
3 quarters
|
|

12
Spectrum Brands
SPB
$2.03B
| $39.1M | 2.67% |
280,947
+8,902
| +3% | +$1.18M |
2015 Q4
5 quarters
|
|

13
Labcorp
LH
$30.2B
| $38.3M | 2.62% |
310,361
+43,157
| +16% | +$5.11M |
2016 Q1
4 quarters
|
|

14
American Express
AXP
$213B
| $34.9M | 2.39% |
441,283
-43,502
| -9% | -$3.4M |
2014 Q4
9 quarters
|
|
|
15
IBM
IBM
$231B
| $27.7M | 1.9% |
166,669
-173,681
| -51% | -$29.1M |
2013 Q2
15 quarters
|
|
|
16
LKQ Corp
LKQ
$4.97B
| $27.7M | 1.9% |
+945,595
| New | +$29.4M |
2017 Q1
0 quarters
|
|

17
Cognizant
CTSH
$28.5B
| $17M | 1.17% |
+285,910
| New | +$16.4M |
2017 Q1
0 quarters
|
|

18
Phillips 66
PSX
$103B
| $14.6M | 1% |
184,161
+76,442
| +71% | +$6.16M |
2016 Q1
4 quarters
|
|

19
Abbott
ABT
$186B
| $14.1M | 0.97% |
317,451
+223,100
| +236% | +$9.6M |
2013 Q2
15 quarters
|
|

20
Berkshire Hathaway Class A
BRK.A
$1.25T
| $12M | 0.82% |
48
| – | – |
2013 Q2
15 quarters
|
|

21
AB InBev
BUD
$165B
| $10.7M | 0.73% |
97,110
+92,829
| +2,168% | +$10M |
2016 Q4
1 quarter
|
|

22
CarMax
KMX
$7.46B
| $9.7M | 0.66% |
163,382
-770
| -0.5% | -$50K |
2016 Q4
1 quarter
|
|

23
Walt Disney
DIS
$204B
| $4.08M | 0.28% |
35,954
+4,608
| +15% | +$507K |
2015 Q4
5 quarters
|
|
|
24
US Bancorp
USB
$94.2B
| $3.05M | 0.21% |
59,145
-241,256
| -80% | -$12.9M |
2013 Q4
13 quarters
|
|

25
Apple
AAPL
$5.16T
| $1.53M | 0.1% |
42,560
-6,812
| -14% | -$224K |
2013 Q2
15 quarters
|
|
Similar funds





Steven Check's Q1 2017 Portfolio in Review
As of Q1 2017, Steven Check held 60 positions worth $1.46B, up 11% from $1.31B the previous quarter. Its ten largest holdings account for 77% of the portfolio.
Steven Check deployed $73.1M of net new capital in Q1 2017, opening 5 new positions and adding to 19 existing holdings. Its largest new stake was LKQ Corp: 945,595 shares worth $27.7M.
By sector, the portfolio is most concentrated in Financials at 29% of assets, down from 37% a quarter earlier, followed by Miscellaneous and Consumer Discretionary.
On the sell side, the largest reduction was Berkshire Hathaway Class B, an estimated $44.7M trimmed.
- Steven Check's largest Q1 2017 buy was LKQ Corp: 945,595 shares worth $27.7M.
- Steven Check added most to Suncor Energy in Q1 2017, an estimated $29.6M increase.
- Steven Check's biggest Q1 2017 reduction was Berkshire Hathaway Class B, cutting an estimated $44.7M.
- Steven Check fully exited Emerson Electric in Q1 2017, selling an estimated $8.26M.
- Steven Check's ten largest holdings make up 77% of its $1.46B portfolio in Q1 2017.
- Steven Check opened 5 new positions and closed 10 in Q1 2017.
- Steven Check's portfolio value rose 11% quarter-over-quarter to $1.46B.
Based on Check Capital Management's 13F filing for Q1 2017, filed 5 May 2017.