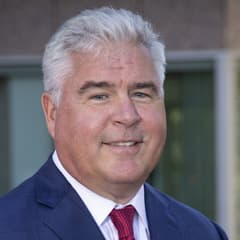
Steven Check Check Capital Management
Steven Check is the founder of Check Capital Management, a value-oriented firm known for research-driven equity portfolios and a long-term client focus. The firm often emphasizes understandable businesses purchased with a margin of safety. Check’s public commentary and portfolio disclosures appeal to investors who prefer classical value frameworks.
Top Buys
| Rank | Stock | Value |
|---|---|---|
| 1 |

American Express
AXP
|
+$22M |
| 2 |

Accenture
ACN
|
+$16.2M |
| 3 |

Wells Fargo
WFC
|
+$11.9M |
| 4 |

Jefferies Financial Group
JEF
|
+$11.9M |
| 5 |

Verizon
VZ
|
+$10.2M |
Top Sells
| Rank | Stock | Value |
|---|---|---|
| 1 |

Fiserv
FISV
|
+$20.7M |
| 2 |

Walmart
WMT
|
+$20.6M |
| 3 |

Labcorp
LH
|
+$19.2M |
| 4 |

Medtronic
MDT
|
+$10.1M |
| 5 |

Johnson & Johnson
JNJ
|
+$2.82M |
Sector Composition
| Rank | Sector | Weight |
|---|---|---|
| 1 | Financials | 46.15% |
| 2 | Miscellaneous | 20.83% |
| 3 | Technology | 17.11% |
| 4 | Consumer Staples | 5.75% |
| 5 | Communication Services | 4.49% |
| Name | Market Value | Portfolio Weight | Shares or Principal |
Change in Stake | Capital Flow | Held Since | |
|---|---|---|---|---|---|---|---|

1
Berkshire Hathaway Class B
BRK.B
$1.25T
| $310M | 27.26% |
2,061,297
+35,225
| +2% | +$5.09M |
2013 Q2
6 quarters
|
|
|
2
CALL
Berkshire Hathaway Class B
BRK.B
$1.25T
| $231M | 20.34% |
1,538,000
+150,300
| +11% | +$21.7M |
2013 Q2
6 quarters
|
|
|
3
Wells Fargo
WFC
$248B
| $97.8M | 8.62% |
1,784,478
+225,662
| +14% | +$11.9M |
2013 Q2
6 quarters
|
|

4
IBM
IBM
$218B
| $61.6M | 5.43% |
401,803
+26,091
| +7% | +$4.15M |
2013 Q2
6 quarters
|
|
|
5
Verizon
VZ
$190B
| $50.6M | 4.46% |
1,081,524
+207,739
| +24% | +$10.2M |
2014 Q1
3 quarters
|
|

6
Aflac
AFL
$63.2B
| $43.5M | 3.83% |
1,424,532
+167,516
| +13% | +$4.95M |
2013 Q2
6 quarters
|
|
|
7
Walmart
WMT
$1.01T
| $40.2M | 3.54% |
1,404,705
-762,324
| -35% | -$20.6M |
2013 Q2
6 quarters
|
|

8
Qualcomm
QCOM
$178B
| $38.9M | 3.42% |
523,142
+23,450
| +5% | +$1.72M |
2013 Q2
6 quarters
|
|

9
Oracle
ORCL
$359B
| $32.7M | 2.88% |
726,786
+39,884
| +6% | +$1.62M |
2013 Q2
6 quarters
|
|
|
DTV
10
DELISTED
DIRECTV
DTV
| $30M | 2.64% |
345,968
-22,433
| -6% | -$1.93M |
2013 Q2
6 quarters
|
|

11
Ingredion
INGR
$5.68B
| $23.9M | 2.1% |
281,557
+23,616
| +9% | +$1.88M |
2014 Q2
2 quarters
|
|
|
12
American Express
AXP
$212B
| $22.8M | 2.01% |
+245,414
| New | +$22M |
2014 Q4
0 quarters
|
|
|
13
Accenture
ACN
$141B
| $20.5M | 1.81% |
230,004
+195,504
| +567% | +$16.2M |
2014 Q1
3 quarters
|
|

14
McDonald's
MCD
$195B
| $20.5M | 1.8% |
218,694
-257
| -0.1% | -$24.1K |
2013 Q2
6 quarters
|
|

15
Markel Group
MKL
$23.9B
| $16.9M | 1.49% |
24,708
+3,262
| +15% | +$2.21M |
2014 Q2
2 quarters
|
|

16
Suncor Energy
SU
$78.5B
| $16.7M | 1.47% |
524,142
+68,622
| +15% | +$2.27M |
2014 Q1
3 quarters
|
|

17
Abbott
ABT
$181B
| $15.1M | 1.33% |
334,802
-19,826
| -6% | -$864K |
2013 Q2
6 quarters
|
|

18
Berkshire Hathaway Class A
BRK.A
$1.24T
| $12M | 1.05% |
53
| – | – |
2013 Q2
6 quarters
|
|
|
19
Jefferies Financial Group
JEF
$9.8B
| $11.6M | 1.02% |
+577,397
| New | +$11.9M |
2014 Q4
0 quarters
|
|

20
US Bancorp
USB
$92.2B
| $8.59M | 0.76% |
191,112
-8,822
| -4% | -$380K |
2013 Q4
4 quarters
|
|
|
21
Fiserv
FISV
$33.2B
| $5.33M | 0.47% |
150,152
-605,536
| -80% | -$20.7M |
2013 Q2
6 quarters
|
|
|
22
CALL
IBM
IBM
$218B
| $5.12M | 0.45% |
33,367
-88,701
| -73% | -$14.1M |
2013 Q2
6 quarters
|
|
|
23
Johnson & Johnson
JNJ
$671B
| $3.85M | 0.34% |
36,809
-26,749
| -42% | -$2.82M |
2013 Q2
6 quarters
|
|

24
Apple
AAPL
$5.11T
| $2.18M | 0.19% |
78,916
-8,176
| -9% | -$222K |
2013 Q2
6 quarters
|
|
|
25
Medtronic
MDT
$131B
| $1.44M | 0.13% |
19,943
-145,190
| -88% | -$10.1M |
2013 Q2
6 quarters
|
|
Similar funds






Steven Check's Q4 2014 Portfolio in Review
As of Q4 2014, Steven Check held 71 positions worth $1.14B, up 6.3% from $1.07B the previous quarter. Its ten largest holdings account for 82% of the portfolio.
Steven Check's Q4 2014 filing shows 5 new, 29 increased, 22 reduced and 10 closed positions. Its largest new stake was American Express: 245,414 shares worth $22.8M. The largest sale was Fiserv, an estimated $20.7M.
By sector, the portfolio is most concentrated in Financials at 46% of assets, up from 40% a quarter earlier, followed by Miscellaneous and Technology.
- Steven Check's largest Q4 2014 buy was American Express: 245,414 shares worth $22.8M.
- Steven Check added most to Accenture in Q4 2014, an estimated $16.2M increase.
- Steven Check's biggest Q4 2014 reduction was Fiserv, cutting an estimated $20.7M.
- Steven Check fully exited EMC in Q4 2014, selling an estimated $607K.
- Steven Check's ten largest holdings make up 82% of its $1.14B portfolio in Q4 2014.
- Steven Check opened 5 new positions and closed 10 in Q4 2014.
- Steven Check's portfolio value rose 6.3% quarter-over-quarter to $1.14B.
Based on Check Capital Management's 13F filing for Q4 2014, filed 23 Jan 2015.