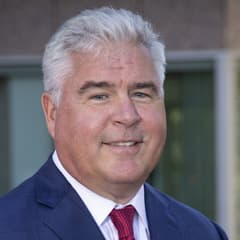
Steven Check Check Capital Management
Steven Check is the founder of Check Capital Management, a value-oriented firm known for research-driven equity portfolios and a long-term client focus. The firm often emphasizes understandable businesses purchased with a margin of safety. Check’s public commentary and portfolio disclosures appeal to investors who prefer classical value frameworks.
Top Buys
| Rank | Stock | Value |
|---|---|---|
| 1 |
PCP
Precision Castparts
PCP
|
+$33.3M |
| 2 |

American Express
AXP
|
+$17.7M |
| 3 |

Suncor Energy
SU
|
+$16.7M |
| 4 |

Emerson Electric
EMR
|
+$16.3M |
| 5 |

Verizon
VZ
|
+$4.01M |
Top Sells
| Rank | Stock | Value |
|---|---|---|
| 1 |

Walmart
WMT
|
+$30.8M |
| 2 |

Abbott
ABT
|
+$10.9M |
| 3 |

Berkshire Hathaway Class B
BRK.B
|
+$7.7M |
| 4 |

Fiserv
FISV
|
+$5.33M |
| 5 |

Jefferies Financial Group
JEF
|
+$4.17M |
Sector Composition
| Rank | Sector | Weight |
|---|---|---|
| 1 | Financials | 44.27% |
| 2 | Miscellaneous | 21.65% |
| 3 | Technology | 16.29% |
| 4 | Communication Services | 4.89% |
| 5 | Industrials | 4.26% |
| Name | Market Value | Portfolio Weight | Shares or Principal |
Change in Stake | Capital Flow | Held Since | |
|---|---|---|---|---|---|---|---|
|
1
Berkshire Hathaway Class B
BRK.B
$1.22T
| $290M | 24.67% |
2,008,998
-52,299
| -3% | -$7.7M |
2013 Q2
7 quarters
|
|
|
2
CALL
Berkshire Hathaway Class B
BRK.B
$1.22T
| $252M | 21.42% |
1,744,600
+206,600
| +13% | +$30.4M |
2013 Q2
7 quarters
|
|

3
Wells Fargo
WFC
$242B
| $97.8M | 8.32% |
1,798,306
+13,828
| +0.8% | +$747K |
2013 Q2
7 quarters
|
|

4
IBM
IBM
$212B
| $64.7M | 5.51% |
421,848
+20,045
| +5% | +$3.04M |
2013 Q2
7 quarters
|
|
|
5
Verizon
VZ
$190B
| $56.6M | 4.82% |
1,164,566
+83,042
| +8% | +$4.01M |
2014 Q1
4 quarters
|
|

6
Aflac
AFL
$61.7B
| $46.5M | 3.96% |
1,453,296
+28,764
| +2% | +$877K |
2013 Q2
7 quarters
|
|

7
Qualcomm
QCOM
$173B
| $38.6M | 3.28% |
556,022
+32,880
| +6% | +$2.32M |
2013 Q2
7 quarters
|
|
|
8
American Express
AXP
$209B
| $35.8M | 3.05% |
458,100
+212,686
| +87% | +$17.7M |
2014 Q4
1 quarter
|
|

9
Oracle
ORCL
$345B
| $33.6M | 2.86% |
779,062
+52,276
| +7% | +$2.27M |
2013 Q2
7 quarters
|
|
|
PCP
10
DELISTED
Precision Castparts
PCP
| $32.9M | 2.8% |
+156,820
| New | +$33.3M |
2015 Q1
0 quarters
|
|
|
11
Suncor Energy
SU
$73.6B
| $31.7M | 2.7% |
1,085,366
+561,224
| +107% | +$16.7M |
2014 Q1
4 quarters
|
|
|
DTV
12
DELISTED
DIRECTV
DTV
| $28.8M | 2.45% |
338,143
-7,825
| -2% | -$676K |
2013 Q2
7 quarters
|
|

13
Ingredion
INGR
$5.51B
| $24.2M | 2.06% |
311,013
+29,456
| +10% | +$2.41M |
2014 Q2
3 quarters
|
|

14
Markel Group
MKL
$23.9B
| $21.8M | 1.86% |
28,374
+3,666
| +15% | +$2.65M |
2014 Q2
3 quarters
|
|

15
McDonald's
MCD
$192B
| $21.1M | 1.8% |
216,927
-1,767
| -0.8% | -$168K |
2013 Q2
7 quarters
|
|

16
Accenture
ACN
$129B
| $21M | 1.78% |
223,800
-6,204
| -3% | -$554K |
2014 Q1
4 quarters
|
|
|
17
Emerson Electric
EMR
$86.5B
| $15.9M | 1.35% |
+280,006
| New | +$16.3M |
2015 Q1
0 quarters
|
|

18
Berkshire Hathaway Class A
BRK.A
$1.22T
| $11.5M | 0.98% |
53
| – | – |
2013 Q2
7 quarters
|
|
|
19
Walmart
WMT
$1000B
| $8.77M | 0.75% |
319,881
-1,084,824
| -77% | -$30.8M |
2013 Q2
7 quarters
|
|

20
US Bancorp
USB
$89.2B
| $8.17M | 0.7% |
187,093
-4,019
| -2% | -$176K |
2013 Q4
5 quarters
|
|
|
21
Jefferies Financial Group
JEF
$9.39B
| $7.49M | 0.64% |
375,404
-201,993
| -35% | -$4.17M |
2014 Q4
1 quarter
|
|

22
Johnson & Johnson
JNJ
$643B
| $5.32M | 0.45% |
52,914
+16,105
| +44% | +$1.64M |
2013 Q2
7 quarters
|
|
|
23
Abbott
ABT
$180B
| $4.48M | 0.38% |
96,775
-238,027
| -71% | -$10.9M |
2013 Q2
7 quarters
|
|

24
Apple
AAPL
$5.07T
| $2.48M | 0.21% |
79,816
+900
| +1% | +$27.2K |
2013 Q2
7 quarters
|
|
|
25
CALL
IBM
IBM
$212B
| $2.25M | 0.19% |
14,644
-18,723
| -56% | -$2.84M |
2013 Q2
7 quarters
|
|
Similar funds






Steven Check's Q1 2015 Portfolio in Review
As of Q1 2015, Steven Check held 66 positions worth $1.18B, up 3.5% from $1.14B the previous quarter. Its ten largest holdings account for 81% of the portfolio.
Steven Check deployed $40.9M of net new capital in Q1 2015, opening 5 new positions and adding to 17 existing holdings. Its largest new stake was Precision Castparts: 156,820 shares worth $32.9M.
By sector, the portfolio is most concentrated in Financials at 44% of assets, down from 46% a quarter earlier, followed by Miscellaneous and Technology.
On the sell side, the largest reduction was Walmart, an estimated $30.8M trimmed.
- Steven Check's largest Q1 2015 buy was Precision Castparts: 156,820 shares worth $32.9M.
- Steven Check added most to American Express in Q1 2015, an estimated $17.7M increase.
- Steven Check's biggest Q1 2015 reduction was Walmart, cutting an estimated $30.8M.
- Steven Check fully exited Fiserv in Q1 2015, selling an estimated $5.33M.
- Steven Check's ten largest holdings make up 81% of its $1.18B portfolio in Q1 2015.
- Steven Check opened 5 new positions and closed 9 in Q1 2015.
- Steven Check's portfolio value rose 3.5% quarter-over-quarter to $1.18B.
Based on Check Capital Management's 13F filing for Q1 2015, filed 1 May 2015.