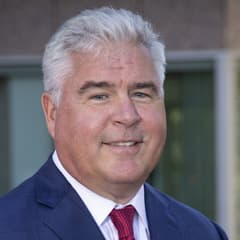
Steven Check Check Capital Management
Steven Check is the founder of Check Capital Management, a value-oriented firm known for research-driven equity portfolios and a long-term client focus. The firm often emphasizes understandable businesses purchased with a margin of safety. Check’s public commentary and portfolio disclosures appeal to investors who prefer classical value frameworks.
Top Buys
| Rank | Stock | Value |
|---|---|---|
| 1 |

Johnson & Johnson
JNJ
|
+$5.91M |
| 2 |

Berkshire Hathaway Class B
BRK.B
|
+$3.31M |
| 3 |

Walmart Inc
WMT
|
+$1.91M |
| 4 |

Microsoft
MSFT
|
+$1.91M |
| 5 |

Qualcomm
QCOM
|
+$1.8M |
Top Sells
| Rank | Stock | Value |
|---|---|---|
| 1 |

Accenture
ACN
|
+$2.72M |
| 2 |

Wells Fargo
WFC
|
+$2.16M |
| 3 |

McDonald's
MCD
|
+$1.88M |
| 4 |

Abbott
ABT
|
+$1.27M |
| 5 |

Synaptics
SYNA
|
+$616K |
Sector Composition
| Rank | Sector | Weight |
|---|---|---|
| 1 | Financials | 46.75% |
| 2 | Miscellaneous | 15.53% |
| 3 | Technology | 13.79% |
| 4 | Communication Services | 5.16% |
| 5 | Industrials | 4.92% |
| Name | Market Value | Portfolio Weight | Shares or Principal |
Change in Stake | Capital Flow | Held Since | |
|---|---|---|---|---|---|---|---|
|
1
Berkshire Hathaway Class B
BRK.B
$1.25T
| $263M | 25.69% |
2,016,191
+24,133
| +1% | +$3.31M |
2013 Q2
9 quarters
|
|
|
2
CALL
Berkshire Hathaway Class B
BRK.B
$1.25T
| $157M | 15.3% |
1,200,500
-8,600
| -0.7% | -$1.18M |
2013 Q2
9 quarters
|
|
|
3
Wells Fargo
WFC
$257B
| $88.7M | 8.67% |
1,727,906
-39,303
| -2% | -$2.16M |
2013 Q2
9 quarters
|
|

4
IBM
IBM
$231B
| $57.8M | 5.65% |
416,898
+342
| +0.1% | +$50.5K |
2013 Q2
9 quarters
|
|

5
Verizon
VZ
$193B
| $52.1M | 5.09% |
1,197,840
+30,341
| +3% | +$1.4M |
2014 Q1
6 quarters
|
|

6
Aflac
AFL
$62.6B
| $42.9M | 4.2% |
1,477,162
+40,048
| +3% | +$1.21M |
2013 Q2
9 quarters
|
|
|
PCP
7
DELISTED
PRECISION CASTPARTS CORP
PCP
| $37M | 3.62% |
161,035
+7,510
| +5% | +$1.61M |
2015 Q1
2 quarters
|
|

8
American Express
AXP
$213B
| $34.1M | 3.34% |
460,410
+12,530
| +3% | +$964K |
2014 Q4
3 quarters
|
|
|
ESRX
9
DELISTED
Express Scripts Holding Company
ESRX
| $31.6M | 3.09% |
390,140
+19,630
| +5% | +$1.71M |
2014 Q3
4 quarters
|
|
|
10
Qualcomm
QCOM
$190B
| $30.9M | 3.02% |
575,541
+30,258
| +6% | +$1.8M |
2013 Q2
9 quarters
|
|

11
Suncor Energy
SU
$79.8B
| $29.1M | 2.84% |
1,089,144
+29,429
| +3% | +$790K |
2014 Q1
6 quarters
|
|

12
Ingredion
INGR
$5.78B
| $28.4M | 2.77% |
324,728
+16,558
| +5% | +$1.42M |
2014 Q2
5 quarters
|
|

13
Oracle
ORCL
$396B
| $27.4M | 2.67% |
757,655
-1,185
| -0.2% | -$45.6K |
2013 Q2
9 quarters
|
|

14
Markel Group
MKL
$24B
| $23.5M | 2.3% |
29,337
+789
| +3% | +$668K |
2014 Q2
5 quarters
|
|
|
15
McDonald's
MCD
$193B
| $18.4M | 1.8% |
187,143
-19,283
| -9% | -$1.88M |
2013 Q2
9 quarters
|
|
|
16
Accenture
ACN
$148B
| $18.3M | 1.79% |
186,300
-27,400
| -13% | -$2.72M |
2014 Q1
6 quarters
|
|

17
US Bancorp
USB
$94.2B
| $14.9M | 1.45% |
362,715
-2,768
| -0.8% | -$120K |
2013 Q4
7 quarters
|
|
|
18
Johnson & Johnson
JNJ
$683B
| $12.8M | 1.25% |
136,653
+61,109
| +81% | +$5.91M |
2013 Q2
9 quarters
|
|

19
Emerson Electric
EMR
$91.6B
| $12M | 1.17% |
271,456
-8,706
| -3% | -$428K |
2015 Q1
2 quarters
|
|

20
Berkshire Hathaway Class A
BRK.A
$1.25T
| $10.2M | 0.99% |
52
-1
| -2% | -$206K |
2013 Q2
9 quarters
|
|
|
21
Walmart Inc
WMT
$1T
| $9.6M | 0.94% |
444,159
+83,463
| +23% | +$1.91M |
2013 Q2
9 quarters
|
|

22
Harley-Davidson
HOG
$3.28B
| $6.27M | 0.61% |
114,289
-6,135
| -5% | -$346K |
2015 Q2
1 quarter
|
|
|
23
Microsoft
MSFT
$3.88T
| $3.86M | 0.38% |
87,312
+42,609
| +95% | +$1.91M |
2013 Q2
9 quarters
|
|
|
24
Abbott
ABT
$186B
| $2.34M | 0.23% |
58,282
-26,923
| -32% | -$1.27M |
2013 Q2
9 quarters
|
|
|
25
CALL
IBM
IBM
$231B
| $1.74M | 0.17% |
12,552
-2,092
| -14% | -$309K |
2013 Q2
9 quarters
|
|
Similar funds






Steven Check's Q3 2015 Portfolio in Review
As of Q3 2015, Steven Check held 54 positions worth $1.02B, down 3.9% from $1.06B the previous quarter. Its ten largest holdings account for 78% of the portfolio.
Steven Check's Q3 2015 filing shows 3 new, 21 increased, 20 reduced and 2 closed positions. Its largest new stake was MSC Industrial Direct: 3,865 shares worth $236K. The largest sale was Accenture, an estimated $2.72M.
By sector, the portfolio is most concentrated in Financials at 47% of assets, down from 47% a quarter earlier, followed by Miscellaneous and Technology.
- Steven Check's largest Q3 2015 buy was MSC Industrial Direct: 3,865 shares worth $236K.
- Steven Check added most to Johnson & Johnson in Q3 2015, an estimated $5.91M increase.
- Steven Check's biggest Q3 2015 reduction was Accenture, cutting an estimated $2.72M.
- Steven Check fully exited Synaptics in Q3 2015, selling an estimated $616K.
- Steven Check's ten largest holdings make up 78% of its $1.02B portfolio in Q3 2015.
- Steven Check opened 3 new positions and closed 2 in Q3 2015.
- Steven Check's portfolio value fell 3.9% quarter-over-quarter to $1.02B.
Based on Check Capital Management's 13F filing for Q3 2015, filed 12 Nov 2015.