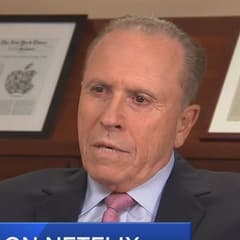
Robert Olstein Olstein Capital Management
Robert Olstein is the founder of Olstein Capital Management and a long-time advocate of forensic accounting and quality-of-earnings analysis in equity investing. His process looks beyond headline multiples to assess earnings sustainability and balance-sheet risk. Olstein’s work is frequently referenced by investors who prioritize accounting diligence.
Top Buys
| Rank | Stock | Value |
|---|---|---|
| 1 |

Booz Allen Hamilton
BAH
|
+$5.56M |
| 2 |

Avantor
AVTR
|
+$3.86M |
| 3 |

SS&C Technologies
SSNC
|
+$3.84M |
| 4 |

Equifax
EFX
|
+$3.77M |
| 5 |

Waters Corp
WAT
|
+$3.42M |
Top Sells
| Rank | Stock | Value |
|---|---|---|
| 1 |

Kulicke & Soffa
KLIC
|
+$5.18M |
| 2 |

FedEx
FDX
|
+$4.17M |
| 3 |

SLB Ltd
SLB
|
+$4.13M |
| 4 |

Target
TGT
|
+$4.01M |
| 5 |

Deere & Co
DE
|
+$3.49M |
Sector Composition
| Rank | Sector | Weight |
|---|---|---|
| 1 | Industrials | 20.49% |
| 2 | Technology | 18.14% |
| 3 | Healthcare | 16.41% |
| 4 | Financials | 15.79% |
| 5 | Consumer Discretionary | 10.63% |
| Name | Market Value | Portfolio Weight | Shares or Principal |
Change in Stake | Capital Flow | Held Since | |
|---|---|---|---|---|---|---|---|

76
RTX Corp
RTX
$261B
| $2.22M | 0.48% |
11,500
-4,500
| -28% | -$895K |
2013 Q2
51 quarters
|
|

77
Alphabet (Google) Class C
GOOG
$4.12T
| $2.15M | 0.47% |
7,500
| – | – |
2017 Q1
36 quarters
|
|

78
Gates Industrial Corp
GTES
$6.54B
| $1.68M | 0.37% |
74,500
-9,500
| -11% | -$231K |
2021 Q1
20 quarters
|
|

79
Central Garden & Pet Co Class A
CENTA
$2.27B
| $1.46M | 0.32% |
45,000
-7,500
| -14% | -$239K |
2017 Q3
34 quarters
|
|

80
eBay
EBAY
$53.5B
| $1.46M | 0.32% |
16,000
-6,000
| -27% | -$539K |
2013 Q2
51 quarters
|
|

81
Prestige Consumer Healthcare
PBH
$2.36B
| $1.24M | 0.27% |
21,000
| – | – |
2017 Q1
36 quarters
|
|

82
Aebi Schmidt Holding AG
AEBI
$861M
| $1.23M | 0.27% |
127,000
-20,122
| -14% | -$276K |
2025 Q3
2 quarters
|
|

83
Tennant Co
TNC
$1.11B
| $1.13M | 0.25% |
17,000
+4,000
| +31% | +$291K |
2024 Q4
5 quarters
|
|

84
First Advantage
FA
$3.29B
| $1.12M | 0.24% |
95,000
+21,000
| +28% | +$257K |
2023 Q3
10 quarters
|
|

85
Blue Bird Corp
BLBD
$1.95B
| $1.11M | 0.24% |
19,526
-3,474
| -15% | -$187K |
2017 Q2
35 quarters
|
|

86
Goldman Sachs
GS
$257B
| $1.02M | 0.22% |
1,200
-300
| -20% | -$268K |
2018 Q2
31 quarters
|
|

87
Cushman & Wakefield Ltd
CWK
$2.65B
| $1M | 0.22% |
82,000
-6,500
| -7% | -$93.2K |
2022 Q1
16 quarters
|
|

88
Miller Industries
MLR
$584M
| $979K | 0.21% |
21,500
| – | – |
2013 Q2
51 quarters
|
|

89
Home BancShares
HOMB
$5.84B
| $956K | 0.21% |
35,500
-1,500
| -4% | -$42.2K |
2018 Q2
31 quarters
|
|

90
Progyny
PGNY
$2.06B
| $951K | 0.21% |
56,000
+20,000
| +56% | +$429K |
2025 Q1
4 quarters
|
|

91
First Hawaiian
FHB
$3.04B
| $912K | 0.2% |
37,000
-3,000
| -8% | -$77.2K |
2020 Q2
23 quarters
|
|

92
Vishay Intertechnology
VSH
$4.25B
| $846K | 0.18% |
47,000
-30,000
| -39% | -$545K |
2019 Q3
26 quarters
|
|

93
Prosperity Bancshares
PB
$8.15B
| $806K | 0.18% |
12,000
| – | – |
2017 Q1
36 quarters
|
|

94
NOV
NOV
$6.75B
| $790K | 0.17% |
42,000
-5,000
| -11% | -$93.9K |
2025 Q2
3 quarters
|
|

95
AGCO
AGCO
$7.26B
| $753K | 0.16% |
6,500
-2,500
| -28% | -$303K |
2024 Q2
7 quarters
|
|

96
Douglas Dynamics
PLOW
$912M
| $738K | 0.16% |
17,543
-12,457
| -42% | -$503K |
2024 Q1
8 quarters
|
|

97
Corning
GLW
$114B
| $680K | 0.15% |
5,000
-25,000
| -83% | -$3.01M |
2013 Q4
49 quarters
|
|

98
Brady Corp
BRC
$3.84B
| $609K | 0.13% |
7,500
-3,000
| -29% | -$261K |
2020 Q4
21 quarters
|
|

99
Timken Company
TKR
$7.79B
| $503K | 0.11% |
5,000
-3,300
| -40% | -$328K |
2021 Q2
19 quarters
|
|

100
Cummins
CMI
$73.1B
| – | – |
-4,700
| Closed | -$2.4M | – |
|
Similar funds
Robert Olstein's Q1 2026 Portfolio in Review
As of Q1 2026, Robert Olstein held 103 positions worth $458M, down 6.1% from $488M the previous quarter. Its ten largest holdings account for 19% of the portfolio.
Robert Olstein's Q1 2026 filing shows 2 new, 28 increased, 59 reduced and 4 closed positions. Its largest new stake was Booz Allen Hamilton: 66,000 shares worth $5.15M. The largest sale was Kulicke & Soffa, an estimated $5.18M.
By sector, the portfolio is most concentrated in Industrials at 20% of assets, down from 22% a quarter earlier, followed by Technology and Healthcare.
- Robert Olstein's largest Q1 2026 buy was Booz Allen Hamilton: 66,000 shares worth $5.15M.
- Robert Olstein added most to Avantor in Q1 2026, an estimated $3.86M increase.
- Robert Olstein's biggest Q1 2026 reduction was Kulicke & Soffa, cutting an estimated $5.18M.
- Robert Olstein fully exited Deere & Co in Q1 2026, selling an estimated $3.49M.
- Robert Olstein's ten largest holdings make up 19% of its $458M portfolio in Q1 2026.
- Robert Olstein opened 2 new positions and closed 4 in Q1 2026.
- Robert Olstein's portfolio value fell 6.1% quarter-over-quarter to $458M.
Based on Olstein Capital Management's 13F filing for Q1 2026, filed 21 Apr 2026.