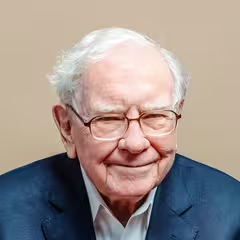
Warren Buffett Berkshire Hathaway
Warren Buffett is one of the world’s most renowned investors and business magnates, often referred to as the “Oracle of Omaha”. As the chairman and CEO of Berkshire Hathaway, he has spent decades building his fortune and reputation through value investing, a strategy focused on purchasing undervalued companies with strong fundamentals.
Top-Käufe
Top-Verkäufe
Sektoraufteilung
| Rang | Sektor | Gewichtung |
|---|---|---|
| 1 | Finanzwesen | 40,15 % |
| 2 | Basiskonsumgüter | 26,43 % |
| 3 | Technologie | 17,2 % |
| 4 | Energie | 7,64 % |
| 5 | Industrie | 2,49 % |
| Name | Marktwert | Portfolioanteil | Stückzahl oder Nennbetrag |
Positions- änderung | Kapitalfluss | Im Bestand seit | |
|---|---|---|---|---|---|---|---|

1
Wells Fargo
WFC
236 Mrd. $
| 19,1 Mrd. $ | 20,81 % |
463.131.623
| – | – |
Q2 2013
0 Quartale
|
|

2
Coca-Cola
KO
417 Mrd. $
| 16 Mrd. $ | 17,47 % |
400.000.000
| – | – |
Q2 2013
0 Quartale
|
|

3
IBM
IBM
212 Mrd. $
| 13 Mrd. $ | 14,17 % |
68.121.984
| – | – |
Q2 2013
0 Quartale
|
|

4
American Express
AXP
202 Mrd. $
| 11,3 Mrd. $ | 12,34 % |
151.610.700
| – | – |
Q2 2013
0 Quartale
|
|

5
Procter & Gamble
PG
393 Mrd. $
| 4,06 Mrd. $ | 4,43 % |
52.793.078
| – | – |
Q2 2013
0 Quartale
|
|

6
Walmart
WMT
1,02 Bio. $
| 3,67 Mrd. $ | 3,99 % |
147.741.705
| – | – |
Q2 2013
0 Quartale
|
|

7
US Bancorp
USB
87,3 Mrd. $
| 2,83 Mrd. $ | 3,08 % |
78.277.301
| – | – |
Q2 2013
0 Quartale
|
|

8
ExxonMobil
XOM
653 Mrd. $
| 2,82 Mrd. $ | 3,07 % |
31.244.110
| – | – |
Q2 2013
0 Quartale
|
|
|
DTV
9
Nicht mehr gelistet
DIRECTV
DTV
| 2,3 Mrd. $ | 2,5 % |
37.275.400
| – | – |
Q2 2013
0 Quartale
|
|

10
DaVita
DVA
10,1 Mrd. $
| 1,81 Mrd. $ | 1,97 % |
29.947.812
| – | – |
Q2 2013
0 Quartale
|
|

11
Phillips 66
PSX
93,4 Mrd. $
| 1,6 Mrd. $ | 1,74 % |
27.163.918
| – | – |
Q2 2013
0 Quartale
|
|

12
Moody's
MCO
80,5 Mrd. $
| 1,52 Mrd. $ | 1,65 % |
24.922.178
| – | – |
Q2 2013
0 Quartale
|
|

13
ConocoPhillips
COP
161 Mrd. $
| 1,46 Mrd. $ | 1,59 % |
24.123.911
| – | – |
Q2 2013
0 Quartale
|
|

14
General Motors Company Common Stock
GM
66,4 Mrd. $
| 1,33 Mrd. $ | 1,45 % |
40.000.000
| – | – |
Q2 2013
0 Quartale
|
|

15
Graham Holdings
GHC
5,22 Mrd. $
| 836 Mio. $ | 0,91 % |
1.727.765
| – | – |
Q2 2013
0 Quartale
|
|

16
Liberty Media Series A
FWONA
25,4 Mrd. $
| 713 Mio. $ | 0,78 % |
8.006.145
| – | – |
Q2 2013
0 Quartale
|
|

17
Bank of New York Mellon
BNY
95 Mrd. $
| 691 Mio. $ | 0,75 % |
24.644.029
| – | – |
Q2 2013
0 Quartale
|
|

18
NOV
NOV
5,71 Mrd. $
| 612 Mio. $ | 0,67 % |
8.880.000
| – | – |
Q2 2013
0 Quartale
|
|

19
M&T Bank
MTB
29,9 Mrd. $
| 601 Mio. $ | 0,65 % |
5.382.040
| – | – |
Q2 2013
0 Quartale
|
|
|
CBI
20
Nicht mehr gelistet
Chicago Bridge & Iron
CBI
| 570 Mio. $ | 0,62 % |
9.550.755
| – | – |
Q2 2013
0 Quartale
|
|

21
Suncor Energy
SU
73,5 Mrd. $
| 524 Mio. $ | 0,57 % |
17.769.457
| – | – |
Q2 2013
0 Quartale
|
|
|
VIAB
22
Nicht mehr gelistet
Viacom Class B
VIAB
| 518 Mio. $ | 0,56 % |
7.607.200
| – | – |
Q2 2013
0 Quartale
|
|

23
VeriSign
VRSN
27,5 Mrd. $
| 487 Mio. $ | 0,53 % |
10.897.420
| – | – |
Q2 2013
0 Quartale
|
|

24
Costco
COST
488 Mrd. $
| 479 Mio. $ | 0,52 % |
4.333.363
| – | – |
Q2 2013
0 Quartale
|
|
|
PCP
25
Nicht mehr gelistet
Precision Castparts
PCP
| 447 Mio. $ | 0,49 % |
1.977.336
| – | – |
Q2 2013
0 Quartale
|
|
Ähnliche Fonds








Portfolio-Rückblick von Warren Buffett für Q2 2013
Für Warren Buffett ist Q2 2013 das erste Quartal, für das eine 13F-Meldung vorliegt. Darin wurden 43 Positionen im Wert von 91,9 Mrd. $ offengelegt. Die zehn größten Positionen machen 84 % des Portfolios aus.
Die größte Position ist Wells Fargo: 463.131.623 Aktien im Wert von 19,1 Mrd. $.
Nach Sektoren ist das Portfolio am stärksten in Finanzwesen mit einem Anteil von 40 % am verwalteten Vermögen konzentriert, gefolgt von Basiskonsumgüter und Technologie.
- Im Q2 2013 machen die zehn größten Positionen von Warren Buffett 84 % des Portfolios mit einem verwalteten Vermögen von 91,9 Mrd. $ aus.
- In der ersten erfassten 13F-Meldung von Warren Buffett für Q2 2013 wurden 43 Positionen offengelegt.
Auf Grundlage der von Berkshire Hathaway für Q2 2013 am 15. Aug. 2013 eingereichten 13F-Meldung.