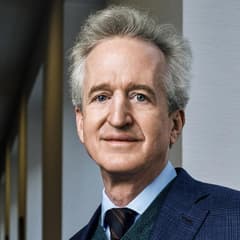
Christopher Davis Davis Selected Advisers
Christopher Davis is chairman of Davis Advisors, a multi-generational investment firm known for research-intensive equity management. The firm’s strategies often emphasize financials and other businesses where long-term ownership and careful accounting analysis matter. Davis is a frequent public commentator on active management and long-horizon investing.
Top-Käufe
| Rang | Aktie | Wert |
|---|---|---|
| 1 |

New Oriental
EDU
|
+135 Mio. $ |
| 2 |

Applied Materials
AMAT
|
+90,7 Mio. $ |
| 3 |

CVS Health
CVS
|
+84,4 Mio. $ |
| 4 |

Quest Diagnostics
DGX
|
+62,4 Mio. $ |
| 5 |

iShares S&P 500 Value ETF
IVE
|
+55 Mio. $ |
Größte Verkäufe
| Rang | Aktie | Wert |
|---|---|---|
| 1 |
AET
Aetna Inc
AET
|
+933 Mio. $ |
| 2 |
SHPG
Shire
SHPG
|
+297 Mio. $ |
| 3 |

GE Aerospace
GE
|
+119 Mio. $ |
| 4 |

APA
APA
|
+43,2 Mio. $ |
| 5 |
ESRX
Express Scripts Holding
ESRX
|
+36,9 Mio. $ |
Sektoraufteilung
| Rang | Sektor | Gewichtung |
|---|---|---|
| 1 | Finanzwesen | 42,47 % |
| 2 | Kommunikationsdienste | 13,64 % |
| 3 | Nicht-Basiskonsumgüter | 11,91 % |
| 4 | Industrie | 10,18 % |
| 5 | Technologie | 7,64 % |
| Name | Marktwert | Portfolioanteil | Aktien oder Kapitalbetrag |
Änderung der Beteiligung | Kapitalfluss | Im Bestand seit | |
|---|---|---|---|---|---|---|---|

1
Wells Fargo
WFC
248 Mrd. $
| 1,24 Mrd. $ | 6,94 % |
26.971.021
-149.380
| -0,6 % | -7,65 Mio. $ |
2013 Q2
22 Quartale
|
|

2
Berkshire Hathaway Class A
BRK.A
1,24 Bio. $
| 1,08 Mrd. $ | 6,02 % |
3.519
-16
| -0,5 % | -5,01 Mio. $ |
2013 Q2
22 Quartale
|
|

3
Amazon
AMZN
2,79 Bio. $
| 1,06 Mrd. $ | 5,94 % |
14.182.000
-430.400
| -3 % | -35,8 Mio. $ |
2013 Q2
22 Quartale
|
|

4
Alphabet (Google) Class C
GOOG
3,41 Bio. $
| 1,06 Mrd. $ | 5,91 % |
20.411.160
-257.400
| -1 % | -13,8 Mio. $ |
2013 Q2
22 Quartale
|
|

5
Capital One
COF
112 Mrd. $
| 1 Mrd. $ | 5,6 % |
13.267.950
-179.211
| -1 % | -15,5 Mio. $ |
2014 Q3
17 Quartale
|
|

6
RTX
RTX
267 Mrd. $
| 875 Mio. $ | 4,89 % |
13.063.471
+36.196
| +0,3 % | +2,84 Mio. $ |
2015 Q2
14 Quartale
|
|

7
Bank of New York Mellon
BNY
101 Mrd. $
| 821 Mio. $ | 4,59 % |
17.462.483
-74.995
| -0,4 % | -3,64 Mio. $ |
2013 Q2
22 Quartale
|
|

8
JPMorgan Chase
JPM
876 Mrd. $
| 784 Mio. $ | 4,38 % |
8.033.318
-59.995
| -0,7 % | -6,39 Mio. $ |
2013 Q2
22 Quartale
|
|

9
Meta Platforms (Facebook)
META
1,58 Bio. $
| 691 Mio. $ | 3,86 % |
5.267.533
+289.382
| +6 % | +41,9 Mio. $ |
2015 Q4
12 Quartale
|
|

10
American Express
AXP
212 Mrd. $
| 621 Mio. $ | 3,47 % |
6.516.995
-242.185
| -4 % | -25,3 Mio. $ |
2013 Q2
22 Quartale
|
|
|
11
APA
APA
15,7 Mrd. $
| 601 Mio. $ | 3,36 % |
22.882.206
-1.171.458
| -5 % | -43,2 Mio. $ |
2015 Q4
12 Quartale
|
|

12
Alibaba
BABA
216 Mrd. $
| 570 Mio. $ | 3,18 % |
4.153.816
+206.372
| +5 % | +30,5 Mio. $ |
2016 Q4
8 Quartale
|
|
|
13
New Oriental
EDU
8,29 Mrd. $
| 563 Mio. $ | 3,15 % |
10.273.245
+2.328.455
| +29 % | +135 Mio. $ |
2016 Q2
10 Quartale
|
|

14
Alphabet (Google) Class A
GOOGL
3,44 Bio. $
| 522 Mio. $ | 2,92 % |
9.990.660
-576.060
| -5 % | -31,1 Mio. $ |
2015 Q4
12 Quartale
|
|
|
15
Applied Materials
AMAT
277 Mrd. $
| 432 Mio. $ | 2,42 % |
13.214.457
+2.646.045
| +25 % | +90,7 Mio. $ |
2013 Q2
22 Quartale
|
|

16
US Bancorp
USB
92,2 Mrd. $
| 422 Mio. $ | 2,36 % |
9.230.157
-12.979
| -0,1 % | -668.067 $ |
2013 Q2
22 Quartale
|
|

17
Texas Instruments
TXN
270 Mrd. $
| 405 Mio. $ | 2,26 % |
4.285.380
-138.670
| -3 % | -13,4 Mio. $ |
2013 Q2
22 Quartale
|
|
|
18
GE Aerospace
GE
339 Mrd. $
| 386 Mio. $ | 2,16 % |
10.648.065
-2.630.922
| -20 % | -119 Mio. $ |
2018 Q3
1 Quartal
|
|

19
Johnson Controls International
JCI
81,8 Mrd. $
| 374 Mio. $ | 2,09 % |
12.607.660
-631.574
| -5 % | -20,8 Mio. $ |
2015 Q3
13 Quartale
|
|

20
Berkshire Hathaway Class B
BRK.B
1,25 Bio. $
| 357 Mio. $ | 1,99 % |
1.751.245
-63.290
| -3 % | -13,2 Mio. $ |
2013 Q2
22 Quartale
|
|

21
Microsoft
MSFT
3,76 Bio. $
| 293 Mio. $ | 1,64 % |
2.889.277
-74.418
| -3 % | -7,97 Mio. $ |
2013 Q2
22 Quartale
|
|

22
Chubb
CB
144 Mrd. $
| 282 Mio. $ | 1,58 % |
2.186.403
+8.757
| +0,4 % | +1,13 Mio. $ |
2013 Q2
22 Quartale
|
|

23
Markel Group
MKL
23,9 Mrd. $
| 255 Mio. $ | 1,43 % |
246.090
+3.691
| +2 % | +4,04 Mio. $ |
2013 Q2
22 Quartale
|
|

24
Ovintiv
OVV
17,2 Mrd. $
| 240 Mio. $ | 1,34 % |
8.305.999
-30.377
| -0,4 % | -1,31 Mio. $ |
2014 Q3
17 Quartale
|
|

25
Loews
L
22,3 Mrd. $
| 194 Mio. $ | 1,08 % |
4.260.915
+13.270
| +0,3 % | +625.468 $ |
2013 Q2
22 Quartale
|
|
Ähnliche Fonds








Portfolio-Rückblick von Christopher Davis für Q4 2018
Zum Stand von Q4 2018 hielt Christopher Davis 148 Positionen im Wert von 17,9 Mrd. $, ein Rückgang um 23 % gegenüber 23,3 Mrd. $ im Vorquartal. Die zehn größten Positionen machen 52 % des Portfolios aus.
Christopher Davis zog im Q4 2018 netto 1,05 Mrd. $ ab, schloss 11 Positionen und reduzierte 50 Bestände. Der bemerkenswerteste Ausstieg war Aetna Inc – eine Position im geschätzten Wert von 933 Mio. $, die vollständig verkauft wurde.
Nach Sektoren betrachtet ist das Portfolio mit 42 % des verwalteten Vermögens am stärksten in Finanzwesen gewichtet, gegenüber 41 % im Vorquartal. Es folgen Kommunikationsdienste und Nicht-Basiskonsumgüter.
Entgegen dem Trend eröffnete Christopher Davis eine neue Position in CVS Health im Wert von 74 Mio. $.
- Der größte Kauf von Christopher Davis im Q4 2018 war CVS Health: 1.130.059 Aktien im Wert von 74 Mio. $.
- Christopher Davis hat seine Position in New Oriental in Q4 2018 am stärksten aufgestockt – der geschätzte Zuwachs beträgt 135 Mio. $.
- Der größte Positionsabbau von Christopher Davis im Q4 2018 entfiel auf Shire und belief sich schätzungsweise auf 297 Mio. $.
- Christopher Davis hat seine Position in Aetna Inc im Q4 2018 vollständig aufgelöst und dabei schätzungsweise 933 Mio. $ verkauft.
- Die zehn größten Positionen von Christopher Davis machen im Q4 2018 52 % des Portfolios mit einem verwalteten Vermögen von 17,9 Mrd. $ aus.
- Christopher Davis eröffnete 9 neue Positionen und schloss 11 Positionen im Q4 2018.
- Der Portfoliowert von Christopher Davis sank gegenüber dem Vorquartal um 23 % auf 17,9 Mrd. $.
Auf Grundlage der von Davis Selected Advisers für Q4 2018 am 12. Feb. 2019 eingereichten 13F-Meldung .