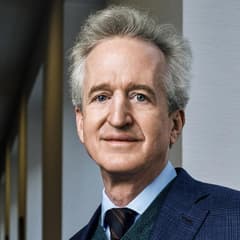
Christopher Davis Davis Selected Advisers
Christopher Davis is chairman of Davis Advisors, a multi-generational investment firm known for research-intensive equity management. The firm’s strategies often emphasize financials and other businesses where long-term ownership and careful accounting analysis matter. Davis is a frequent public commentator on active management and long-horizon investing.
Top-Käufe
| Rang | Aktie | Wert |
|---|---|---|
| 1 |

GE Aerospace
GE
|
+819 Mio. $ |
| 2 |

Applied Materials
AMAT
|
+445 Mio. $ |
| 3 |

New Oriental
EDU
|
+255 Mio. $ |
| 4 |

Magnolia Oil & Gas
MGY
|
+131 Mio. $ |
| 5 |

JD.com
JD
|
+67,8 Mio. $ |
Größte Verkäufe
| Rang | Aktie | Wert |
|---|---|---|
| 1 |

Johnson Controls International
JCI
|
+496 Mio. $ |
| 2 |

JPMorgan Chase
JPM
|
+433 Mio. $ |
| 3 |

Amazon
AMZN
|
+324 Mio. $ |
| 4 |

Occidental Petroleum
OXY
|
+274 Mio. $ |
| 5 |

Ovintiv
OVV
|
+208 Mio. $ |
Sektoraufteilung
| Rang | Sektor | Gewichtung |
|---|---|---|
| 1 | Finanzwesen | 41,43 % |
| 2 | Kommunikationsdienste | 12,68 % |
| 3 | Nicht-Basiskonsumgüter | 12,66 % |
| 4 | Industrie | 10,78 % |
| 5 | Energie | 8,14 % |
| Name | Marktwert | Portfolioanteil | Aktien oder Kapitalbetrag |
Änderung der Beteiligung | Kapitalfluss | Im Bestand seit | |
|---|---|---|---|---|---|---|---|
|
1
Amazon
AMZN
2,87 Bio. $
| 1,46 Mrd. $ | 6,29 % |
14.612.400
-3.448.040
| -19 % | -324 Mio. $ |
2013 Q2
21 Quartale
|
|

2
Wells Fargo
WFC
258 Mrd. $
| 1,43 Mrd. $ | 6,13 % |
27.120.401
+51.036
| +0,2 % | +2,91 Mio. $ |
2013 Q2
21 Quartale
|
|

3
Capital One
COF
117 Mrd. $
| 1,28 Mrd. $ | 5,49 % |
13.447.161
-12.071
| -0,1 % | -1,17 Mio. $ |
2014 Q3
16 Quartale
|
|

4
Alphabet (Google) Class C
GOOG
3,58 Bio. $
| 1,23 Mrd. $ | 5,3 % |
20.668.560
-1.806.780
| -8 % | -108 Mio. $ |
2013 Q2
21 Quartale
|
|

5
APA Corp
APA
16,1 Mrd. $
| 1,15 Mrd. $ | 4,93 % |
24.053.664
+100.116
| +0,4 % | +4,51 Mio. $ |
2015 Q4
11 Quartale
|
|

6
RTX Corp
RTX
266 Mrd. $
| 1,15 Mrd. $ | 4,93 % |
13.027.275
-233.391
| -2 % | -19,6 Mio. $ |
2015 Q2
13 Quartale
|
|

7
Berkshire Hathaway Class A
BRK.A
1,26 Bio. $
| 1,13 Mrd. $ | 4,86 % |
3.535
-328
| -8 % | -102 Mio. $ |
2013 Q2
21 Quartale
|
|
|
AET
8
Nicht mehr gelistet
Aetna Inc
AET
| 933 Mio. $ | 4,01 % |
4.598.174
+2.707
| +0,1 % | +529.020 $ |
2016 Q3
8 Quartale
|
|
|
9
JPMorgan Chase
JPM
915 Mrd. $
| 913 Mio. $ | 3,93 % |
8.093.313
-3.816.506
| -32 % | -433 Mio. $ |
2013 Q2
21 Quartale
|
|

10
Bank of New York Mellon
BNY
102 Mrd. $
| 894 Mio. $ | 3,84 % |
17.537.478
-1.352.012
| -7 % | -71,1 Mio. $ |
2013 Q2
21 Quartale
|
|

11
Meta Platforms (Facebook)
META
1,6 Bio. $
| 819 Mio. $ | 3,52 % |
4.978.151
-86.207
| -2 % | -15,6 Mio. $ |
2015 Q4
11 Quartale
|
|

12
American Express
AXP
215 Mrd. $
| 720 Mio. $ | 3,09 % |
6.759.180
-505.560
| -7 % | -52,6 Mio. $ |
2013 Q2
21 Quartale
|
|
|
13
GE Aerospace
GE
343 Mrd. $
| 718 Mio. $ | 3,09 % |
+13.278.987
| Neu | +819 Mio. $ |
2018 Q3
0 Quartale
|
|

14
Alibaba
BABA
233 Mrd. $
| 650 Mio. $ | 2,8 % |
3.947.444
+37.723
| +1 % | +6,68 Mio. $ |
2016 Q4
7 Quartale
|
|

15
Alphabet (Google) Class A
GOOGL
3,62 Bio. $
| 638 Mio. $ | 2,74 % |
10.566.720
-2.648.380
| -20 % | -160 Mio. $ |
2015 Q4
11 Quartale
|
|
|
16
New Oriental
EDU
8,25 Mrd. $
| 588 Mio. $ | 2,53 % |
7.944.790
+3.070.648
| +63 % | +255 Mio. $ |
2016 Q2
9 Quartale
|
|
|
17
Ovintiv
OVV
17,4 Mrd. $
| 546 Mio. $ | 2,35 % |
8.336.376
-3.202.625
| -28 % | -208 Mio. $ |
2014 Q3
16 Quartale
|
|

18
US Bancorp
USB
94,5 Mrd. $
| 488 Mio. $ | 2,1 % |
9.243.136
+4.571
| +0 % | +242.142 $ |
2013 Q2
21 Quartale
|
|

19
Texas Instruments
TXN
272 Mrd. $
| 475 Mio. $ | 2,04 % |
4.424.050
-400.659
| -8 % | -44,6 Mio. $ |
2013 Q2
21 Quartale
|
|
|
20
Johnson Controls International
JCI
83,9 Mrd. $
| 463 Mio. $ | 1,99 % |
13.239.234
-13.449.360
| -50 % | -496 Mio. $ |
2015 Q3
12 Quartale
|
|

21
Adient
ADNT
1,18 Mrd. $
| 444 Mio. $ | 1,91 % |
11.306.775
+351.899
| +3 % | +15,9 Mio. $ |
2016 Q4
7 Quartale
|
|
|
22
Applied Materials
AMAT
283 Mrd. $
| 408 Mio. $ | 1,76 % |
10.568.412
+10.052.435
| +1.948 % | +445 Mio. $ |
2013 Q2
21 Quartale
|
|

23
Berkshire Hathaway Class B
BRK.B
1,26 Bio. $
| 389 Mio. $ | 1,67 % |
1.814.535
-31.443
| -2 % | -6,45 Mio. $ |
2013 Q2
21 Quartale
|
|

24
Microsoft
MSFT
3,88 Bio. $
| 339 Mio. $ | 1,46 % |
2.963.695
-291.651
| -9 % | -31,6 Mio. $ |
2013 Q2
21 Quartale
|
|
|
SHPG
25
Nicht mehr gelistet
Shire pic
SHPG
| 337 Mio. $ | 1,45 % |
1.860.595
-4.280
| -0,2 % | -740.710 $ |
2018 Q1
2 Quartale
|
|
Ähnliche Fonds








Portfolio-Rückblick von Christopher Davis für Q3 2018
Zum Stand von Q3 2018 hielt Christopher Davis 149 Positionen im Wert von 23,3 Mrd. $, ein Rückgang um 0,99 % gegenüber 23,5 Mrd. $ im Vorquartal. Die zehn größten Positionen machen 50 % des Portfolios aus.
Die Meldung von Christopher Davis für Q3 2018 weist 11 neu, 63 erhöht, 51 reduziert und 10 geschlossen Positionen aus. Seine größte neue Position war GE Aerospace: 13.278.987 Aktien im Wert von 718 Mio. $. Der größte Verkauf betraf Johnson Controls International mit einem geschätzten Wert von 496 Mio. $.
Nach Sektoren ist das Portfolio mit 41 % des Vermögens am stärksten auf Finanzwesen konzentriert, gegenüber 42 % ein Quartal zuvor. Es folgen Kommunikationsdienste und Nicht-Basiskonsumgüter.
- Der größte Kauf von Christopher Davis im Q3 2018 war GE Aerospace: 13.278.987 Aktien im Wert von 718 Mio. $.
- Christopher Davis hat seine Position in Applied Materials in Q3 2018 am stärksten aufgestockt – der geschätzte Zuwachs beträgt 445 Mio. $.
- Der größte Positionsabbau von Christopher Davis im Q3 2018 entfiel auf Johnson Controls International und belief sich schätzungsweise auf 496 Mio. $.
- Christopher Davis hat seine Position in Occidental Petroleum im Q3 2018 vollständig aufgelöst und dabei schätzungsweise 274 Mio. $ verkauft.
- Die zehn größten Positionen von Christopher Davis machen im Q3 2018 50 % des Portfolios mit einem verwalteten Vermögen von 23,3 Mrd. $ aus.
- Christopher Davis eröffnete 11 neue Positionen und schloss 10 Positionen im Q3 2018.
- Der Portfoliowert von Christopher Davis sank gegenüber dem Vorquartal um 0,99 % auf 23,3 Mrd. $.
Auf Grundlage der von Davis Selected Advisers für Q3 2018 am 13. Nov. 2018 eingereichten 13F-Meldung .