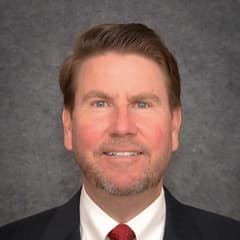
David Rolfe Wedgewood Partners
David Rolfe is the chief investment officer of Wedgewood Partners, known for a concentrated growth portfolio of large-capitalization companies. The firm emphasizes quality franchises, high returns on capital, and limited diversification across only a few dozen names at most. Rolfe’s commentaries are followed by investors who prefer focused growth ownership over broad index replication.
Top Buys
| Rank | Stock | Value |
|---|---|---|
| 1 |

Perrigo
PRGO
|
+$200M |
| 2 |

Stericycle Inc
SRCL
|
+$87.9M |
| 3 |

The Kraft Heinz Company
KHC
|
+$59.7M |
Top Sells
| Rank | Stock | Value |
|---|---|---|
| 1 |

Tapestry
TPR
|
+$324M |
| 2 |

NOV
NOV
|
+$261M |
| 3 |

Cummins
CMI
|
+$164M |
| 4 |
VAR
Varian Medical Systems, Inc.
VAR
|
+$151M |
| 5 |

Alphabet (Google) Class A
GOOGL
|
+$70M |
Sector Composition
| Rank | Sector | Weight |
|---|---|---|
| 1 | Financials | 23.12% |
| 2 | Technology | 22.26% |
| 3 | Healthcare | 12.98% |
| 4 | Consumer Discretionary | 9.68% |
| 5 | Energy | 9.35% |
| Name | Market Value | Portfolio Weight | Shares or Principal |
Change in Stake | Capital Flow | Held Since | |
|---|---|---|---|---|---|---|---|

1
Berkshire Hathaway Class B
BRK.B
$1.16T
| $554M | 9.51% |
4,192,862
-476,286
| -10% | -$63.9M |
2013 Q2
10 quarters
|
|

2
Apple
AAPL
$5.07T
| $509M | 8.74% |
19,342,720
-890,468
| -4% | -$25.4M |
2013 Q2
10 quarters
|
|
|
ESRX
3
DELISTED
Express Scripts Holding Company
ESRX
| $448M | 7.69% |
5,120,114
-626,851
| -11% | -$53.7M |
2013 Q2
10 quarters
|
|

4
Qualcomm
QCOM
$188B
| $422M | 7.25% |
8,444,517
-1,102,840
| -12% | -$58.8M |
2013 Q2
10 quarters
|
|

5
M&T Bank
MTB
$32B
| $372M | 6.39% |
3,071,234
-477,631
| -13% | -$58.2M |
2013 Q3
9 quarters
|
|

6
Cognizant
CTSH
$31.8B
| $362M | 6.21% |
6,024,952
-855,812
| -12% | -$55.2M |
2013 Q2
10 quarters
|
|

7
SLB Ltd
SLB
$78.3B
| $332M | 5.7% |
4,757,412
-510,387
| -10% | -$38.2M |
2013 Q2
10 quarters
|
|
|
8
Perrigo
PRGO
$2.21B
| $306M | 5.25% |
2,113,216
+1,297,542
| +159% | +$200M |
2013 Q2
10 quarters
|
|

9
Booking.com
BKNG
$117B
| $294M | 5.06% |
5,774,750
-677,875
| -11% | -$35.8M |
2013 Q2
10 quarters
|
|

10
Verisk Analytics
VRSK
$25.5B
| $274M | 4.7% |
3,562,860
-358,969
| -9% | -$27.3M |
2013 Q2
10 quarters
|
|

11
LKQ Corp
LKQ
$4.41B
| $266M | 4.56% |
8,962,062
-441,476
| -5% | -$12.8M |
2014 Q1
7 quarters
|
|
|
12
DELISTED
Stericycle Inc
SRCL
| $261M | 4.48% |
2,161,249
+689,925
| +47% | +$87.9M |
2013 Q2
10 quarters
|
|
|
MJN
13
DELISTED
Mead Johnson Nutrition Company
MJN
| $248M | 4.25% |
3,137,622
-359,539
| -10% | -$28.3M |
2014 Q1
7 quarters
|
|

14
Visa
V
$766B
| $248M | 4.25% |
3,193,704
-585,185
| -15% | -$45.3M |
2013 Q2
10 quarters
|
|
|
15
Alphabet (Google) Class A
GOOGL
$3.92T
| $242M | 4.15% |
6,218,280
-1,890,900
| -23% | -$70M |
2015 Q3
1 quarter
|
|
|
16
The Kraft Heinz Company
KHC
$29.4B
| $239M | 4.1% |
3,280,187
+808,905
| +33% | +$59.7M |
2015 Q3
1 quarter
|
|

17
Core Laboratories
CLB
$455M
| $211M | 3.61% |
1,935,874
-239,316
| -11% | -$27.4M |
2014 Q4
4 quarters
|
|

18
PayPal
PYPL
$48.8B
| $173M | 2.97% |
4,782,121
-432,202
| -8% | -$15.2M |
2015 Q3
1 quarter
|
|

19
Alphabet (Google) Class C
GOOG
$3.88T
| $52M | 0.89% |
1,370,160
-836,800
| -38% | -$30M |
2013 Q2
10 quarters
|
|
|
20
Tapestry
TPR
$21.9B
| $3.78M | 0.07% |
115,651
-10,397,191
| -99% | -$324M |
2013 Q2
10 quarters
|
|

21
DELISTED
EMC CORPORATION
EMC
| $3.3M | 0.06% |
128,440
-95,029
| -43% | -$2.47M |
2013 Q2
10 quarters
|
|
|
VAR
22
DELISTED
Varian Medical Systems, Inc.
VAR
| $2.56M | 0.04% |
36,150
-2,182,372
| -98% | -$151M |
2013 Q2
10 quarters
|
|
|
23
NOV
NOV
$7.04B
| $2.32M | 0.04% |
69,450
-7,014,667
| -99% | -$261M |
2013 Q2
10 quarters
|
|
|
24
Cummins
CMI
$71.2B
| $1.51M | 0.03% |
17,175
-1,639,068
| -99% | -$164M |
2013 Q2
10 quarters
|
|
Similar funds






David Rolfe's Q4 2015 Portfolio in Review
As of Q4 2015, David Rolfe held 24 positions worth $5.82B, down 15% from $6.87B the previous quarter. Its ten largest holdings account for 66% of the portfolio.
David Rolfe withdrew a net $1.2B in Q4 2015, reducing 21 holdings. Its largest reduction was Tapestry, cutting an estimated $324M.
By sector, the portfolio is most concentrated in Financials at 23% of assets, up from 21% a quarter earlier, followed by Technology and Healthcare.
Against the trend, David Rolfe added an estimated $200M to Perrigo.
- David Rolfe added most to Perrigo in Q4 2015, an estimated $200M increase.
- David Rolfe's biggest Q4 2015 reduction was Tapestry, cutting an estimated $324M.
- David Rolfe's ten largest holdings make up 66% of its $5.82B portfolio in Q4 2015.
- David Rolfe opened 0 new positions and closed 0 in Q4 2015.
- David Rolfe's portfolio value fell 15% quarter-over-quarter to $5.82B.
Based on Wedgewood Partners's 13F filing for Q4 2015, filed 16 Feb 2016.