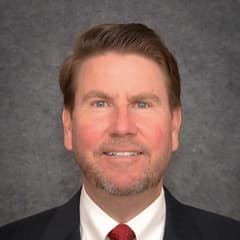
David Rolfe Wedgewood Partners
David Rolfe is the chief investment officer of Wedgewood Partners, known for a concentrated growth portfolio of large-capitalization companies. The firm emphasizes quality franchises, high returns on capital, and limited diversification across only a few dozen names at most. Rolfe’s commentaries are followed by investors who prefer focused growth ownership over broad index replication.
Top Buys
| Rank | Stock | Value |
|---|---|---|
| 1 |

Ulta Beauty
ULTA
|
+$11.1M |
| 2 |

Meta Platforms (Facebook)
META
|
+$10.8M |
| 3 |

Charles Schwab
SCHW
|
+$7.55M |
| 4 |

Fastenal
FAST
|
+$6.45M |
| 5 |

Booking.com
BKNG
|
+$2.85M |
Top Sells
| Rank | Stock | Value |
|---|---|---|
| 1 |

SLB Ltd
SLB
|
+$63.1M |
| 2 |

Core Laboratories
CLB
|
+$36.1M |
| 3 |

Berkshire Hathaway Class B
BRK.B
|
+$17.7M |
| 4 |

Apple
AAPL
|
+$15.9M |
| 5 |

Tractor Supply
TSCO
|
+$13.7M |
Sector Composition
| Rank | Sector | Weight |
|---|---|---|
| 1 | Financials | 27.39% |
| 2 | Consumer Discretionary | 19.85% |
| 3 | Technology | 16.58% |
| 4 | Communication Services | 12.56% |
| 5 | Industrials | 12.19% |
| Name | Market Value | Portfolio Weight | Shares or Principal |
Change in Stake | Capital Flow | Held Since | |
|---|---|---|---|---|---|---|---|
|
1
Berkshire Hathaway Class B
BRK.B
$1.16T
| $151M | 10.04% |
740,620
-84,911
| -10% | -$17.7M |
2013 Q2
22 quarters
|
|
|
2
Apple
AAPL
$5.03T
| $126M | 8.37% |
3,198,664
-328,340
| -9% | -$15.9M |
2013 Q2
22 quarters
|
|

3
Edwards Lifesciences
EW
$53B
| $126M | 8.35% |
2,463,396
+6,516
| +0.3% | +$330K |
2017 Q1
7 quarters
|
|

4
Visa
V
$773B
| $117M | 7.73% |
883,306
-98,134
| -10% | -$13.6M |
2013 Q2
22 quarters
|
|
|
5
Meta Platforms (Facebook)
META
$1.6T
| $100M | 6.66% |
764,970
+74,506
| +11% | +$10.8M |
2018 Q1
3 quarters
|
|
|
6
Booking.com
BKNG
$111B
| $96.6M | 6.41% |
1,402,325
+38,800
| +3% | +$2.85M |
2013 Q2
22 quarters
|
|
|
7
Tractor Supply
TSCO
$17.7B
| $94M | 6.24% |
5,630,260
-761,450
| -12% | -$13.7M |
2016 Q4
8 quarters
|
|

8
Alphabet (Google) Class A
GOOGL
$3.44T
| $81.8M | 5.43% |
1,565,880
-148,640
| -9% | -$8.03M |
2015 Q3
13 quarters
|
|
|
9
Fastenal
FAST
$59.6B
| $80.6M | 5.35% |
6,163,172
+476,740
| +8% | +$6.45M |
2016 Q4
8 quarters
|
|

10
Qualcomm
QCOM
$176B
| $79.3M | 5.26% |
1,393,863
-143,299
| -9% | -$8.7M |
2013 Q2
22 quarters
|
|

11
PayPal
PYPL
$47.4B
| $70.5M | 4.68% |
837,884
-104,744
| -11% | -$8.72M |
2015 Q3
13 quarters
|
|
|
12
Charles Schwab
SCHW
$152B
| $70.2M | 4.66% |
1,690,643
+167,009
| +11% | +$7.55M |
2016 Q1
11 quarters
|
|

13
Ross Stores
ROST
$72.9B
| $55.9M | 3.71% |
671,647
-64,915
| -9% | -$5.88M |
2016 Q2
10 quarters
|
|
|
14
Ulta Beauty
ULTA
$27.4B
| $52.6M | 3.49% |
214,810
+40,015
| +23% | +$11.1M |
2018 Q3
1 quarter
|
|

15
C.H. Robinson
CHRW
$14.4B
| $52.2M | 3.46% |
620,821
-63,199
| -9% | -$5.66M |
2018 Q3
1 quarter
|
|

16
Old Dominion Freight Line
ODFL
$35.8B
| $50.6M | 3.36% |
1,228,233
-143,988
| -10% | -$6.38M |
2018 Q3
1 quarter
|
|

17
Cognizant
CTSH
$29.1B
| $44M | 2.92% |
693,474
-72,820
| -10% | -$5.07M |
2013 Q2
22 quarters
|
|
|
CELG
18
DELISTED
Celgene Corp
CELG
| $42M | 2.78% |
654,632
-102,742
| -14% | -$7.58M |
2017 Q1
7 quarters
|
|

19
Alphabet (Google) Class C
GOOG
$3.42T
| $5.36M | 0.36% |
103,600
-780
| -0.7% | -$41.8K |
2013 Q2
22 quarters
|
|

20
US Bancorp
USB
$92.6B
| $2.75M | 0.18% |
60,138
-7,500
| -11% | -$386K |
2016 Q1
11 quarters
|
|
|
21
SLB Ltd
SLB
$79.3B
| $1.24M | 0.08% |
34,450
-1,279,819
| -97% | -$63.1M |
2013 Q2
22 quarters
|
|

22
Blackstone
BX
$94.6B
| $1.11M | 0.07% |
37,325
+2,250
| +6% | +$74.4K |
2016 Q1
11 quarters
|
|

23
Verizon
VZ
$185B
| $1.05M | 0.07% |
18,750
-375
| -2% | -$21.3K |
2016 Q1
11 quarters
|
|

24
Johnson & Johnson
JNJ
$658B
| $813K | 0.05% |
6,300
| – | – |
2016 Q1
11 quarters
|
|

25
AT&T
T
$144B
| $677K | 0.04% |
31,445
+8,145
| +35% | +$190K |
2016 Q1
11 quarters
|
|
Similar funds






David Rolfe's Q4 2018 Portfolio in Review
As of Q4 2018, David Rolfe held 36 positions worth $1.51B, down 24% from $2B the previous quarter. Its ten largest holdings account for 70% of the portfolio.
David Rolfe withdrew a net $178M in Q4 2018, closing 1 position and reducing 19 holdings. Its most notable exit was The Kraft Heinz Company, an estimated $771K position sold in full.
By sector, the portfolio is most concentrated in Financials at 27% of assets, up from 24% a quarter earlier, followed by Consumer Discretionary and Technology.
Against the trend, David Rolfe added an estimated $11.1M to Ulta Beauty.
- David Rolfe added most to Ulta Beauty in Q4 2018, an estimated $11.1M increase.
- David Rolfe's biggest Q4 2018 reduction was SLB Ltd, cutting an estimated $63.1M.
- David Rolfe fully exited The Kraft Heinz Company in Q4 2018, selling an estimated $771K.
- David Rolfe's ten largest holdings make up 70% of its $1.51B portfolio in Q4 2018.
- David Rolfe opened 0 new positions and closed 1 in Q4 2018.
- David Rolfe's portfolio value fell 24% quarter-over-quarter to $1.51B.
Based on Wedgewood Partners's 13F filing for Q4 2018, filed 14 Feb 2019.