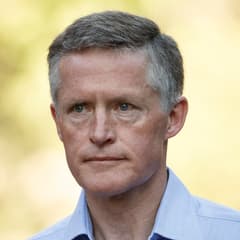
Andreas Halvorsen Viking Global Investors
Andreas Halvorsen is the founder of Viking Global Investors, another prominent firm with roots in Julian Robertson’s Tiger Management. Viking is known for fundamental long/short equity investing and a large, research-intensive platform. Its public filings are widely monitored for institutional-quality growth and cyclical equity ideas.
Top Buys
| Rank | Stock | Value |
|---|---|---|
| 1 |

Wells Fargo
WFC
|
+$659M |
| 2 |

Visa
V
|
+$335M |
| 3 |

Anadarko Petroleum
APC
|
+$210M |
| 4 |

Salesforce
CRM
|
+$186M |
| 5 |

Aflac
AFL
|
+$160M |
Top Sells
| Rank | Stock | Value |
|---|---|---|
| 1 |

Meta Platforms (Facebook)
META
|
+$1.42B |
| 2 |

JD.com
JD
|
+$909M |
| 3 |

Alphabet (Google) Class C
GOOG
|
+$892M |
| 4 |

DuPont de Nemours
DD
|
+$758M |
| 5 |

Walgreens Boots Alliance
WBA
|
+$745M |
Sector Composition
| Rank | Sector | Weight |
|---|---|---|
| 1 | Communication Services | 19.48% |
| 2 | Technology | 17.58% |
| 3 | Healthcare | 13.89% |
| 4 | Industrials | 12.69% |
| 5 | Financials | 11.99% |
| Name | Market Value | Portfolio Weight | Shares or Principal |
Change in Stake | Capital Flow | Held Since | |
|---|---|---|---|---|---|---|---|

1
Microsoft
MSFT
$3.9T
| $1.35B | 9.1% |
19,606,249
-9,412,779
| -32% | -$646M |
2016 Q2
4 quarters
|
|

2
Deere & Co
DE
$186B
| $1.18B | 7.97% |
9,578,765
-4,882,900
| -34% | -$573M |
2016 Q4
2 quarters
|
|
|
3
Meta Platforms (Facebook)
META
$1.59T
| $934M | 6.29% |
6,186,895
-9,575,290
| -61% | -$1.42B |
2016 Q1
5 quarters
|
|

4
Broadcom
AVGO
$1.74T
| $780M | 5.25% |
33,479,130
-2,048,250
| -6% | -$47.5M |
2015 Q2
8 quarters
|
|
|
5
Visa
V
$793B
| $738M | 4.97% |
7,868,000
+3,605,445
| +85% | +$335M |
2016 Q3
3 quarters
|
|
|
6
Wells Fargo
WFC
$258B
| $681M | 4.59% |
+12,297,209
| New | +$659M |
2017 Q2
0 quarters
|
|

7
Ovintiv
OVV
$17.3B
| $640M | 4.31% |
14,554,683
-1,307,035
| -8% | -$67.7M |
2015 Q4
6 quarters
|
|

8
Alphabet (Google) Class A
GOOGL
$3.63T
| $634M | 4.27% |
13,646,080
-14,745,160
| -52% | -$690M |
2015 Q4
6 quarters
|
|
|
TFCFA
9
DELISTED
Twenty-First Century Fox, Inc. Class A
TFCFA
| $633M | 4.27% |
22,350,523
+2,066,937
| +10% | +$59.4M |
2016 Q4
2 quarters
|
|

10
Amazon
AMZN
$2.91T
| $598M | 4.03% |
12,360,920
-9,449,220
| -43% | -$451M |
2015 Q2
8 quarters
|
|

11
UnitedHealth
UNH
$359B
| $486M | 3.27% |
2,620,061
-956,191
| -27% | -$168M |
2016 Q4
2 quarters
|
|

12
Liberty Media Corporation Series C Common Stock
FWONK
$27.9B
| $439M | 2.96% |
12,411,468
| – | – |
2017 Q1
1 quarter
|
|
|
13
Salesforce
CRM
$177B
| $410M | 2.76% |
4,730,124
+2,133,784
| +82% | +$186M |
2017 Q1
1 quarter
|
|
|
14
JD.com
JD
$37B
| $358M | 2.41% |
9,126,849
-24,099,276
| -73% | -$909M |
2016 Q1
5 quarters
|
|

15
DELISTED
Coterra Energy
CTRA
| $356M | 2.39% |
14,176,114
-3,301,068
| -19% | -$78M |
2015 Q4
6 quarters
|
|

16
LyondellBasell Industries
LYB
$20.4B
| $327M | 2.2% |
3,871,318
+1,441,093
| +59% | +$120M |
2016 Q3
3 quarters
|
|
|
RICE
17
DELISTED
Rice Energy Inc.
RICE
| $320M | 2.16% |
12,028,939
-5,545,047
| -32% | -$123M |
2016 Q2
4 quarters
|
|

18
Canadian Pacific Kansas City
CP
$82.1B
| $293M | 1.97% |
9,109,450
-6,693,530
| -42% | -$208M |
2013 Q4
14 quarters
|
|

19
Lennar Class A
LEN
$20.4B
| $286M | 1.93% |
5,636,739
-63,094
| -1% | -$3.1M |
2017 Q1
1 quarter
|
|

20
Netflix
NFLX
$259B
| $251M | 1.69% |
16,805,810
-42,324,510
| -72% | -$651M |
2015 Q3
7 quarters
|
|
|
21
DELISTED
Walgreens Boots Alliance
WBA
| $236M | 1.59% |
3,012,489
-9,050,915
| -75% | -$745M |
2013 Q4
14 quarters
|
|

22
Universal Health Services
UHS
$11.4B
| $213M | 1.43% |
1,742,195
+13,537
| +0.8% | +$1.61M |
2016 Q3
3 quarters
|
|

23
Parker-Hannifin
PH
$121B
| $207M | 1.39% |
1,292,171
+955,552
| +284% | +$151M |
2017 Q1
1 quarter
|
|
|
24
DELISTED
Anadarko Petroleum
APC
| $180M | 1.21% |
+3,964,984
| New | +$210M |
2017 Q2
0 quarters
|
|

25
D.R. Horton
DHI
$39.9B
| $176M | 1.19% |
5,104,313
-923,317
| -15% | -$30.8M |
2017 Q1
1 quarter
|
|
Similar funds






Andreas Halvorsen's Q2 2017 Portfolio in Review
As of Q2 2017, Andreas Halvorsen held 80 positions worth $14.8B, down 34% from $22.6B the previous quarter. Its ten largest holdings account for 55% of the portfolio.
Andreas Halvorsen withdrew a net $8.63B in Q2 2017, closing 27 positions and reducing 20 holdings. Its most notable exit was Alphabet (Google) Class C, an estimated $892M position sold in full.
By sector, the portfolio is most concentrated in Communication Services at 19% of assets, down from 30% a quarter earlier, followed by Technology and Healthcare.
Against the trend, Andreas Halvorsen opened a new position in Wells Fargo worth $681M.
- Andreas Halvorsen's largest Q2 2017 buy was Wells Fargo: 12,297,209 shares worth $681M.
- Andreas Halvorsen added most to Visa in Q2 2017, an estimated $335M increase.
- Andreas Halvorsen's biggest Q2 2017 reduction was Meta Platforms (Facebook), cutting an estimated $1.42B.
- Andreas Halvorsen fully exited Alphabet (Google) Class C in Q2 2017, selling an estimated $892M.
- Andreas Halvorsen's ten largest holdings make up 55% of its $14.8B portfolio in Q2 2017.
- Andreas Halvorsen opened 16 new positions and closed 27 in Q2 2017.
- Andreas Halvorsen's portfolio value fell 34% quarter-over-quarter to $14.8B.
Based on Viking Global Investors's 13F filing for Q2 2017, filed 14 Aug 2017.