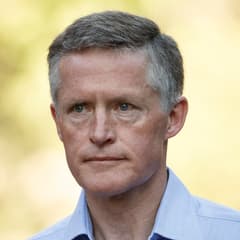
Andreas Halvorsen Viking Global Investors
Andreas Halvorsen is the founder of Viking Global Investors, another prominent firm with roots in Julian Robertson’s Tiger Management. Viking is known for fundamental long/short equity investing and a large, research-intensive platform. Its public filings are widely monitored for institutional-quality growth and cyclical equity ideas.
Top Buys
| Rank | Stock | Value |
|---|---|---|
| 1 |

DuPont de Nemours
DD
|
+$1.08B |
| 2 |

Deere & Co
DE
|
+$875M |
| 3 |

Walgreens Boots Alliance
WBA
|
+$555M |
| 4 |

Microsoft
MSFT
|
+$498M |
| 5 |

Netflix
NFLX
|
+$454M |
Top Sells
| Rank | Stock | Value |
|---|---|---|
| 1 |

Amazon
AMZN
|
+$1.02B |
| 2 |

Teva Pharmaceutical Industries
TEVA
|
+$906M |
| 3 |

Air Products & Chemicals
APD
|
+$725M |
| 4 |

Southwestern Energy
SWN
|
+$585M |
| 5 |

Anadarko Petroleum
APC
|
+$541M |
Sector Composition
| Rank | Sector | Weight |
|---|---|---|
| 1 | Communication Services | 30.16% |
| 2 | Healthcare | 12.22% |
| 3 | Consumer Discretionary | 11.29% |
| 4 | Energy | 10.3% |
| 5 | Technology | 10.18% |
| Name | Market Value | Portfolio Weight | Shares or Principal |
Change in Stake | Capital Flow | Held Since | |
|---|---|---|---|---|---|---|---|

1
Meta Platforms (Facebook)
META
$1.58T
| $2.18B | 9.92% |
18,978,163
+228,753
| +1% | +$28.1M |
2016 Q1
3 quarters
|
|

2
Alphabet (Google) Class A
GOOGL
$3.44T
| $1.43B | 6.51% |
36,155,620
-3,106,960
| -8% | -$124M |
2015 Q4
4 quarters
|
|
|
3
Microsoft
MSFT
$3.76T
| $1.36B | 6.2% |
21,950,056
+8,282,782
| +61% | +$498M |
2016 Q2
2 quarters
|
|
|
4
Amazon
AMZN
$2.79T
| $1.22B | 5.54% |
32,525,380
-26,060,720
| -44% | -$1.02B |
2015 Q2
6 quarters
|
|
|
5
DuPont de Nemours
DD
$19.9B
| $1.12B | 5.11% |
+7,760,161
| New | +$1.08B |
2016 Q4
0 quarters
|
|

6
Ovintiv
OVV
$17.2B
| $1.04B | 4.74% |
17,757,691
+392,611
| +2% | +$22.4M |
2015 Q4
4 quarters
|
|
|
7
Deere & Co
DE
$176B
| $959M | 4.36% |
+9,311,050
| New | +$875M |
2016 Q4
0 quarters
|
|

8
JD.com
JD
$34.3B
| $959M | 4.36% |
37,681,432
+10,427,102
| +38% | +$272M |
2016 Q1
3 quarters
|
|

9
Alphabet (Google) Class C
GOOG
$3.41T
| $833M | 3.78% |
21,581,040
+156,700
| +0.7% | +$6.1M |
2014 Q3
9 quarters
|
|
|
10
Netflix
NFLX
$245B
| $801M | 3.64% |
64,693,120
+38,340,450
| +145% | +$454M |
2015 Q3
5 quarters
|
|

11
Broadcom
AVGO
$1.63T
| $781M | 3.55% |
44,189,190
-1,370,380
| -3% | -$23.7M |
2015 Q2
6 quarters
|
|
|
12
DELISTED
Walgreens Boots Alliance
WBA
| $654M | 2.97% |
7,899,951
+6,708,040
| +563% | +$555M |
2013 Q4
12 quarters
|
|

13
DELISTED
Coterra Energy
CTRA
| $631M | 2.87% |
27,013,169
-8,986,971
| -25% | -$202M |
2015 Q4
4 quarters
|
|

14
Constellation Brands
STZ
$24.4B
| $604M | 2.74% |
3,937,015
+1,261,755
| +47% | +$200M |
2016 Q1
3 quarters
|
|

15
Biogen
BIIB
$37.2B
| $544M | 2.47% |
1,918,812
-267,524
| -12% | -$79.3M |
2015 Q4
4 quarters
|
|

16
T-Mobile US
TMUS
$178B
| $484M | 2.2% |
8,408,861
-5,347,288
| -39% | -$280M |
2016 Q1
3 quarters
|
|

17
Mastercard
MA
$563B
| $444M | 2.02% |
4,304,695
-3,379,561
| -44% | -$350M |
2013 Q2
14 quarters
|
|

18
Visa
V
$778B
| $378M | 1.72% |
4,846,485
+4,268,933
| +739% | +$343M |
2016 Q3
1 quarter
|
|

19
UnitedHealth
UNH
$349B
| $354M | 1.61% |
+2,213,236
| New | +$331M |
2016 Q4
0 quarters
|
|
|
TFCFA
20
DELISTED
Twenty-First Century Fox Class A
TFCFA
| $345M | 1.57% |
+12,287,292
| New | +$331M |
2016 Q4
0 quarters
|
|

21
Canadian Pacific Kansas City
CP
$81.1B
| $329M | 1.49% |
11,507,765
-6,465,525
| -36% | -$191M |
2013 Q4
12 quarters
|
|

22
Charles Schwab
SCHW
$159B
| $318M | 1.45% |
+8,057,576
| New | +$288M |
2016 Q4
0 quarters
|
|

23
Walt Disney
DIS
$202B
| $251M | 1.14% |
+2,403,665
| New | +$234M |
2016 Q4
0 quarters
|
|
|
RICE
24
DELISTED
Rice Energy
RICE
| $239M | 1.09% |
11,206,758
-3,762,957
| -25% | -$89.7M |
2016 Q2
2 quarters
|
|

25
Union Pacific
UNP
$177B
| $218M | 0.99% |
+2,099,301
| New | +$206M |
2016 Q4
0 quarters
|
|
Similar funds





Andreas Halvorsen's Q4 2016 Portfolio in Review
As of Q4 2016, Andreas Halvorsen held 85 positions worth $22B, down 5.1% from $23.2B the previous quarter. Its ten largest holdings account for 54% of the portfolio.
Andreas Halvorsen withdrew a net $969M in Q4 2016, closing 23 positions and reducing 18 holdings. Its most notable exit was Teva Pharmaceutical Industries, an estimated $906M position sold in full.
By sector, the portfolio is most concentrated in Communication Services at 30% of assets, up from 26% a quarter earlier, followed by Healthcare and Consumer Discretionary.
Against the trend, Andreas Halvorsen opened a new position in DuPont de Nemours worth $1.12B.
- Andreas Halvorsen's largest Q4 2016 buy was DuPont de Nemours: 7,760,161 shares worth $1.12B.
- Andreas Halvorsen added most to Walgreens Boots Alliance in Q4 2016, an estimated $555M increase.
- Andreas Halvorsen's biggest Q4 2016 reduction was Amazon, cutting an estimated $1.02B.
- Andreas Halvorsen fully exited Teva Pharmaceutical Industries in Q4 2016, selling an estimated $906M.
- Andreas Halvorsen's ten largest holdings make up 54% of its $22B portfolio in Q4 2016.
- Andreas Halvorsen opened 23 new positions and closed 23 in Q4 2016.
- Andreas Halvorsen's portfolio value fell 5.1% quarter-over-quarter to $22B.
Based on Viking Global Investors's 13F filing for Q4 2016, filed 14 Feb 2017.