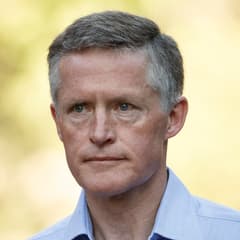
Andreas Halvorsen Viking Global Investors
Andreas Halvorsen is the founder of Viking Global Investors, another prominent firm with roots in Julian Robertson’s Tiger Management. Viking is known for fundamental long/short equity investing and a large, research-intensive platform. Its public filings are widely monitored for institutional-quality growth and cyclical equity ideas.
Top Buys
| Rank | Stock | Value |
|---|---|---|
| 1 |

Meta Platforms (Facebook)
META
|
+$2.12B |
| 2 |

Eli Lilly
LLY
|
+$890M |
| 3 |

Amazon
AMZN
|
+$494M |
| 4 |

Teva Pharmaceutical Industries
TEVA
|
+$465M |
| 5 |

Coterra Energy
CTRA
|
+$461M |
Top Sells
| Rank | Stock | Value |
|---|---|---|
| 1 |
BRCM
Broadcom
BRCM
|
+$1.95B |
| 2 |

Pioneer Natural Resources
PXD
|
+$845M |
| 3 |

Bausch Health
BHC
|
+$792M |
| 4 |

LyondellBasell Industries
LYB
|
+$724M |
| 5 |

McKesson
MCK
|
+$545M |
Sector Composition
| Rank | Sector | Weight |
|---|---|---|
| 1 | Healthcare | 27.81% |
| 2 | Communication Services | 25.25% |
| 3 | Consumer Discretionary | 13% |
| 4 | Energy | 10.38% |
| 5 | Technology | 6.69% |
| Name | Market Value | Portfolio Weight | Shares or Principal |
Change in Stake | Capital Flow | Held Since | |
|---|---|---|---|---|---|---|---|
|
1
Meta Platforms (Facebook)
META
$1.47T
| $2.3B | 10.11% |
+20,133,253
| New | +$2.12B |
2016 Q1
0 quarters
|
|
|
2
Amazon
AMZN
$2.75T
| $2.04B | 8.98% |
68,749,860
+17,400,940
| +34% | +$494M |
2015 Q2
3 quarters
|
|
|
3
Teva Pharmaceutical Industries
TEVA
$45.9B
| $1.76B | 7.77% |
32,971,622
+7,927,847
| +32% | +$465M |
2015 Q3
2 quarters
|
|

4
Alphabet (Google) Class A
GOOGL
$3.4T
| $1.56B | 6.89% |
41,009,740
+3,940,540
| +11% | +$145M |
2015 Q4
1 quarter
|
|

5
Broadcom
AVGO
$1.51T
| $1.52B | 6.69% |
98,327,480
+24,678,570
| +34% | +$334M |
2015 Q2
3 quarters
|
|
|
AGN
6
DELISTED
Allergan plc
AGN
| $1.31B | 5.76% |
4,881,957
-1,096,118
| -18% | -$314M |
2013 Q2
11 quarters
|
|

7
Air Products & Chemicals
APD
$67.4B
| $995M | 4.38% |
7,467,732
+1,646,059
| +28% | +$199M |
2014 Q3
6 quarters
|
|
|
8
Eli Lilly
LLY
$1.21T
| $847M | 3.73% |
+11,763,778
| New | +$890M |
2016 Q1
0 quarters
|
|
|
9
DELISTED
Coterra Energy
CTRA
| $827M | 3.64% |
36,402,693
+22,992,435
| +171% | +$461M |
2015 Q4
1 quarter
|
|

10
Netflix
NFLX
$238B
| $824M | 3.63% |
80,596,820
+2,174,130
| +3% | +$21.3M |
2015 Q3
2 quarters
|
|

11
Alphabet (Google) Class C
GOOG
$3.37T
| $787M | 3.46% |
21,127,680
-1,801,020
| -8% | -$64.5M |
2014 Q3
6 quarters
|
|

12
Elevance Health
ELV
$86.7B
| $674M | 2.97% |
4,849,229
-1,837,736
| -27% | -$246M |
2015 Q2
3 quarters
|
|

13
DELISTED
Walgreens Boots Alliance
WBA
| $529M | 2.33% |
6,279,184
-6,492,313
| -51% | -$518M |
2013 Q4
9 quarters
|
|

14
Ovintiv
OVV
$16.7B
| $491M | 2.16% |
16,116,600
+15,316,911
| +1,915% | +$353M |
2015 Q4
1 quarter
|
|
|
AET
15
DELISTED
Aetna Inc
AET
| $433M | 1.91% |
3,857,803
+2,610,702
| +209% | +$279M |
2015 Q2
3 quarters
|
|

16
JD.com
JD
$34.2B
| $400M | 1.76% |
+15,080,935
| New | +$396M |
2016 Q1
0 quarters
|
|
|
17
DELISTED
Pioneer Natural Resources
PXD
| $360M | 1.58% |
2,555,168
-6,815,937
| -73% | -$845M |
2014 Q1
8 quarters
|
|

18
DELISTED
Gulfport Energy
GPOR
| $322M | 1.42% |
11,377,237
+10,706,570
| +1,596% | +$283M |
2015 Q4
1 quarter
|
|

19
Canadian Pacific Kansas City
CP
$79.8B
| $305M | 1.34% |
11,497,250
-8,510,685
| -43% | -$207M |
2013 Q4
9 quarters
|
|

20
DELISTED
Southwestern Energy
SWN
| $304M | 1.34% |
37,664,133
+25,990,524
| +223% | +$199M |
2015 Q4
1 quarter
|
|

21
Range Resources
RRC
$11.5B
| $287M | 1.26% |
8,862,670
+7,269,160
| +456% | +$202M |
2015 Q4
1 quarter
|
|

22
Trip.com Group
TCOM
$26.1B
| $285M | 1.25% |
6,431,269
+2,664,127
| +71% | +$111M |
2014 Q4
5 quarters
|
|

23
TransDigm Group
TDG
$62.7B
| $243M | 1.07% |
1,101,310
-498,818
| -31% | -$109M |
2015 Q2
3 quarters
|
|

24
Humana
HUM
$47.4B
| $225M | 0.99% |
1,228,373
-3,103,563
| -72% | -$538M |
2014 Q3
6 quarters
|
|

25
Newell Brands
NWL
$2.3B
| $210M | 0.92% |
+4,730,646
| New | +$186M |
2016 Q1
0 quarters
|
|
Similar funds






Andreas Halvorsen's Q1 2016 Portfolio in Review
As of Q1 2016, Andreas Halvorsen held 86 positions worth $22.7B, down 14% from $26.5B the previous quarter. Its ten largest holdings account for 62% of the portfolio.
Andreas Halvorsen withdrew a net $3.16B in Q1 2016, closing 23 positions and reducing 20 holdings. Its most notable exit was Broadcom, an estimated $1.95B position sold in full.
By sector, the portfolio is most concentrated in Healthcare at 28% of assets, down from 35% a quarter earlier, followed by Communication Services and Consumer Discretionary.
Against the trend, Andreas Halvorsen opened a new position in Meta Platforms (Facebook) worth $2.3B.
- Andreas Halvorsen's largest Q1 2016 buy was Meta Platforms (Facebook): 20,133,253 shares worth $2.3B.
- Andreas Halvorsen added most to Amazon in Q1 2016, an estimated $494M increase.
- Andreas Halvorsen's biggest Q1 2016 reduction was Pioneer Natural Resources, cutting an estimated $845M.
- Andreas Halvorsen fully exited Broadcom in Q1 2016, selling an estimated $1.95B.
- Andreas Halvorsen's ten largest holdings make up 62% of its $22.7B portfolio in Q1 2016.
- Andreas Halvorsen opened 22 new positions and closed 23 in Q1 2016.
- Andreas Halvorsen's portfolio value fell 14% quarter-over-quarter to $22.7B.
Based on Viking Global Investors's 13F filing for Q1 2016, filed 16 May 2016.