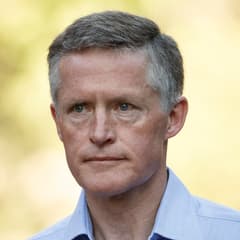
Andreas Halvorsen Viking Global Investors
Andreas Halvorsen is the founder of Viking Global Investors, another prominent firm with roots in Julian Robertson’s Tiger Management. Viking is known for fundamental long/short equity investing and a large, research-intensive platform. Its public filings are widely monitored for institutional-quality growth and cyclical equity ideas.
Top Buys
| Rank | Stock | Value |
|---|---|---|
| 1 |

Biogen
BIIB
|
+$785M |
| 2 |

T-Mobile US
TMUS
|
+$463M |
| 3 |

Mastercard
MA
|
+$428M |
| 4 |

Anadarko Petroleum
APC
|
+$352M |
| 5 |

Microsoft
MSFT
|
+$293M |
Top Sells
| Rank | Stock | Value |
|---|---|---|
| 1 |
AGN
Allergan plc
AGN
|
+$678M |
| 2 |

Elevance Health
ELV
|
+$674M |
| 3 |
AET
Aetna Inc
AET
|
+$333M |
| 4 |

Teva Pharmaceutical Industries Limited
TEVA
|
+$279M |
| 5 |

TransDigm Group
TDG
|
+$243M |
Sector Composition
| Rank | Sector | Weight |
|---|---|---|
| 1 | Communication Services | 23.31% |
| 2 | Healthcare | 21.56% |
| 3 | Consumer Discretionary | 15.15% |
| 4 | Energy | 14.21% |
| 5 | Technology | 8.64% |
| Name | Market Value | Portfolio Weight | Shares or Principal |
Change in Stake | Capital Flow | Held Since | |
|---|---|---|---|---|---|---|---|

1
Amazon
AMZN
$2.8T
| $2.35B | 9.97% |
65,579,680
-3,170,180
| -5% | -$107M |
2015 Q2
4 quarters
|
|

2
Meta Platforms (Facebook)
META
$1.56T
| $2.3B | 9.78% |
20,144,959
+11,706
| +0.1% | +$1.35M |
2016 Q1
1 quarter
|
|

3
Broadcom
AVGO
$1.4T
| $1.59B | 6.75% |
102,197,110
+3,869,630
| +4% | +$58.9M |
2015 Q2
4 quarters
|
|
|
4
Teva Pharmaceutical Industries Limited
TEVA
$49.7B
| $1.39B | 5.92% |
27,736,655
-5,234,967
| -16% | -$279M |
2015 Q3
3 quarters
|
|

5
Alphabet (Google) Class A
GOOGL
$3.5T
| $1.26B | 5.36% |
35,898,540
-5,111,200
| -12% | -$188M |
2015 Q4
2 quarters
|
|

6
Air Products & Chemicals
APD
$67.9B
| $986M | 4.19% |
7,506,899
+39,167
| +0.5% | +$5.22M |
2014 Q3
7 quarters
|
|

7
DELISTED
Coterra Energy
CTRA
| $909M | 3.86% |
35,324,625
-1,078,068
| -3% | -$25.9M |
2015 Q4
2 quarters
|
|
|
8
Biogen
BIIB
$36.7B
| $776M | 3.3% |
3,210,507
+2,979,560
| +1,290% | +$785M |
2015 Q4
2 quarters
|
|

9
Eli Lilly
LLY
$1.21T
| $738M | 3.14% |
9,377,395
-2,386,383
| -20% | -$180M |
2016 Q1
1 quarter
|
|

10
Ovintiv
OVV
$16.3B
| $628M | 2.67% |
16,116,600
| – | – |
2015 Q4
2 quarters
|
|
|
11
T-Mobile US
TMUS
$172B
| $604M | 2.57% |
13,966,540
+11,285,490
| +421% | +$463M |
2016 Q1
1 quarter
|
|

12
Alphabet (Google) Class C
GOOG
$3.49T
| $582M | 2.47% |
16,825,100
-4,302,580
| -20% | -$155M |
2014 Q3
7 quarters
|
|

13
Netflix
NFLX
$260B
| $575M | 2.44% |
62,885,710
-17,711,110
| -22% | -$170M |
2015 Q3
3 quarters
|
|
|
14
Mastercard
MA
$569B
| $566M | 2.41% |
6,432,259
+4,479,636
| +229% | +$428M |
2013 Q2
12 quarters
|
|

15
Newell Brands
NWL
$2.33B
| $483M | 2.05% |
9,936,480
+5,205,834
| +110% | +$243M |
2016 Q1
1 quarter
|
|

16
JD.com
JD
$39.3B
| $478M | 2.03% |
22,494,760
+7,413,825
| +49% | +$179M |
2016 Q1
1 quarter
|
|

17
DELISTED
Southwestern Energy Company
SWN
| $474M | 2.01% |
37,664,133
| – | – |
2015 Q4
2 quarters
|
|
|
AGN
18
DELISTED
Allergan plc
AGN
| $448M | 1.9% |
1,939,703
-2,942,254
| -60% | -$678M |
2013 Q2
12 quarters
|
|
|
19
DELISTED
Anadarko Petroleum
APC
| $416M | 1.77% |
7,802,981
+6,949,514
| +814% | +$352M |
2015 Q4
2 quarters
|
|

20
Range Resources
RRC
$11.4B
| $403M | 1.71% |
9,333,976
+471,306
| +5% | +$19.3M |
2015 Q4
2 quarters
|
|

21
DaVita
DVA
$12B
| $357M | 1.51% |
4,611,729
+2,867,210
| +164% | +$217M |
2016 Q1
1 quarter
|
|

22
Alibaba
BABA
$272B
| $321M | 1.36% |
4,030,758
+2,635,329
| +189% | +$206M |
2014 Q3
7 quarters
|
|
|
CPN
23
DELISTED
Calpine Corporation
CPN
| $300M | 1.28% |
20,366,388
+9,873,137
| +94% | +$146M |
2015 Q4
2 quarters
|
|

24
Intercontinental Exchange
ICE
$96.3B
| $290M | 1.23% |
+5,667,510
| New | +$286M |
2016 Q2
0 quarters
|
|

25
DELISTED
Walgreens Boots Alliance
WBA
| $289M | 1.23% |
3,469,712
-2,809,472
| -45% | -$227M |
2013 Q4
10 quarters
|
|
Similar funds







Andreas Halvorsen's Q2 2016 Portfolio in Review
As of Q2 2016, Andreas Halvorsen held 76 positions worth $23.5B, up 3.6% from $22.7B the previous quarter. Its ten largest holdings account for 55% of the portfolio.
Andreas Halvorsen's Q2 2016 filing shows 13 new, 23 increased, 16 reduced and 21 closed positions. Its largest new stake was Microsoft: 5,633,782 shares worth $288M. The largest sale was Allergan plc, an estimated $678M.
By sector, the portfolio is most concentrated in Communication Services at 23% of assets, down from 25% a quarter earlier, followed by Healthcare and Consumer Discretionary.
- Andreas Halvorsen's largest Q2 2016 buy was Microsoft: 5,633,782 shares worth $288M.
- Andreas Halvorsen added most to Biogen in Q2 2016, an estimated $785M increase.
- Andreas Halvorsen's biggest Q2 2016 reduction was Allergan plc, cutting an estimated $678M.
- Andreas Halvorsen fully exited Elevance Health in Q2 2016, selling an estimated $674M.
- Andreas Halvorsen's ten largest holdings make up 55% of its $23.5B portfolio in Q2 2016.
- Andreas Halvorsen opened 13 new positions and closed 21 in Q2 2016.
- Andreas Halvorsen's portfolio value rose 3.6% quarter-over-quarter to $23.5B.
Based on Viking Global Investors's 13F filing for Q2 2016, filed 15 Aug 2016.