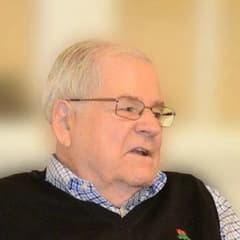
Robert Torray Torray Investment Partners
Robert Torray is the founder of Torray, a long-standing value-oriented investment firm. Torray strategies have historically emphasized careful stock selection, margin of safety, and multi-year holding periods. The firm remains part of the classic U.S. value-manager set tracked through public disclosures.
Top Buys
| Rank | Stock | Value |
|---|---|---|
| 1 |

Arthur J. Gallagher & Co
AJG
|
+$3.93M |
| 2 |

Veeva Systems
VEEV
|
+$3.29M |
| 3 |

EOG Resources
EOG
|
+$2.53M |
| 4 |

Advance Auto Parts
AAP
|
+$2.42M |
| 5 |

Microsoft
MSFT
|
+$662K |
Top Sells
| Rank | Stock | Value |
|---|---|---|
| 1 |

DuPont de Nemours
DD
|
+$7.87M |
| 2 |

Charles Schwab
SCHW
|
+$6.01M |
| 3 |

Nike
NKE
|
+$3.5M |
| 4 |

McDonald's
MCD
|
+$2.32M |
| 5 |

Huntington Ingalls Industries
HII
|
+$2.31M |
Sector Composition
| Rank | Sector | Weight |
|---|---|---|
| 1 | Technology | 22.4% |
| 2 | Financials | 19.73% |
| 3 | Healthcare | 14.52% |
| 4 | Industrials | 10.69% |
| 5 | Consumer Discretionary | 10.56% |
| Name | Market Value | Portfolio Weight | Shares or Principal |
Change in Stake | Capital Flow | Held Since | |
|---|---|---|---|---|---|---|---|

1
Berkshire Hathaway Class B
BRK.B
$1.16T
| $19.8M | 3.55% |
64,106
| – | – |
2017 Q2
23 quarters
|
|

2
Alphabet (Google) Class A
GOOGL
$3.92T
| $19.5M | 3.49% |
187,580
-157
| -0.1% | -$15.1K |
2015 Q3
30 quarters
|
|

3
Fiserv Inc
FISV
$25.2B
| $17.5M | 3.14% |
154,868
-215
| -0.1% | -$23.7K |
2013 Q2
39 quarters
|
|

4
Marsh
MRSH
$90.7B
| $14.5M | 2.6% |
87,022
+90
| +0.1% | +$15K |
2013 Q2
39 quarters
|
|

5
Altria Group
MO
$123B
| $13.8M | 2.48% |
310,031
-31,059
| -9% | -$1.43M |
2018 Q4
17 quarters
|
|

6
JPMorgan Chase
JPM
$892B
| $13.6M | 2.45% |
104,691
-570
| -0.5% | -$78.1K |
2019 Q2
15 quarters
|
|

7
General Dynamics
GD
$96B
| $12.8M | 2.29% |
56,052
| – | – |
2013 Q2
39 quarters
|
|

8
UnitedHealth
UNH
$368B
| $12.6M | 2.26% |
26,677
+2
| +0% | +$965 |
2013 Q2
39 quarters
|
|

9
Phillips 66
PSX
$107B
| $12.6M | 2.26% |
124,092
+18
| +0% | +$1.83K |
2016 Q2
27 quarters
|
|
|
10
Microsoft
MSFT
$3.95T
| $12.4M | 2.23% |
43,168
+2,594
| +6% | +$662K |
2016 Q2
27 quarters
|
|

11
Home Depot
HD
$318B
| $12.4M | 2.22% |
41,904
+207
| +0.5% | +$63.5K |
2020 Q1
12 quarters
|
|

12
Texas Instruments
TXN
$282B
| $12.3M | 2.21% |
66,344
+91
| +0.1% | +$16K |
2022 Q1
4 quarters
|
|

13
American Express
AXP
$210B
| $12.2M | 2.18% |
73,801
+89
| +0.1% | +$14.8K |
2013 Q2
39 quarters
|
|

14
Walt Disney
DIS
$190B
| $12M | 2.15% |
119,815
+144
| +0.1% | +$14.5K |
2020 Q2
11 quarters
|
|

15
Eaton
ETN
$149B
| $12M | 2.15% |
69,976
-11,545
| -14% | -$1.92M |
2013 Q2
39 quarters
|
|

16
Johnson & Johnson
JNJ
$647B
| $11.9M | 2.13% |
76,740
| – | – |
2013 Q2
39 quarters
|
|

17
T. Rowe Price
TROW
$22.1B
| $11.8M | 2.11% |
104,117
+59
| +0.1% | +$6.74K |
2021 Q4
5 quarters
|
|

18
Qualcomm
QCOM
$197B
| $11.7M | 2.11% |
92,056
+698
| +0.8% | +$86.8K |
2016 Q2
27 quarters
|
|

19
Apple
AAPL
$5.07T
| $11.7M | 2.1% |
71,111
-611
| -0.9% | -$90.2K |
2013 Q2
39 quarters
|
|

20
Bristol-Myers Squibb
BMY
$126B
| $11.2M | 2% |
161,134
| – | – |
2020 Q1
12 quarters
|
|

21
Honeywell
HON
$69.3B
| $11.1M | 2% |
61,743
+65
| +0.1% | +$12.2K |
2020 Q2
11 quarters
|
|
|
22
EOG Resources
EOG
$84.5B
| $11.1M | 1.99% |
96,556
+20,893
| +28% | +$2.53M |
2021 Q3
6 quarters
|
|

23
The Kraft Heinz Company
KHC
$28.5B
| $10.4M | 1.87% |
269,215
| – | – |
2019 Q4
13 quarters
|
|

24
Chubb
CB
$137B
| $10.4M | 1.86% |
53,357
+6
| +0% | +$1.26K |
2016 Q1
28 quarters
|
|

25
Lennar Class B
LEN.B
$19.8B
| $9.8M | 1.76% |
115,330
| – | – |
2022 Q4
1 quarter
|
|
Similar funds







Robert Torray's Q1 2023 Portfolio in Review
As of Q1 2023, Robert Torray held 106 positions worth $557M, up 0.37% from $555M the previous quarter. Its ten largest holdings account for 27% of the portfolio.
Robert Torray's Q1 2023 filing shows 2 new, 52 increased, 32 reduced and 6 closed positions. Its largest new stake was Arthur J. Gallagher & Co: 20,719 shares worth $3.96M. The largest sale was DuPont de Nemours, an estimated $7.87M.
By sector, the portfolio is most concentrated in Technology at 22% of assets, up from 19% a quarter earlier, followed by Financials and Healthcare.
- Robert Torray's largest Q1 2023 buy was Arthur J. Gallagher & Co: 20,719 shares worth $3.96M.
- Robert Torray added most to EOG Resources in Q1 2023, an estimated $2.53M increase.
- Robert Torray's biggest Q1 2023 reduction was Eaton, cutting an estimated $1.92M.
- Robert Torray fully exited DuPont de Nemours in Q1 2023, selling an estimated $7.87M.
- Robert Torray's ten largest holdings make up 27% of its $557M portfolio in Q1 2023.
- Robert Torray opened 2 new positions and closed 6 in Q1 2023.
- Robert Torray's portfolio value rose 0.37% quarter-over-quarter to $557M.
Based on Torray Investment Partners's 13F filing for Q1 2023, filed 2 May 2023.