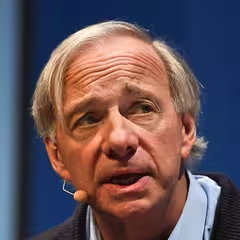
Ray Dalio Bridgewater Associates
Ray Dalio is the founder of Bridgewater Associates, one of the world’s largest hedge funds, known for its unique “principles-based” culture and systematic investment approach. Dalio’s investment philosophy emphasizes diversified portfolios, risk parity, and the importance of understanding economic cycles in shaping investment decisions. He has authored several books, including “Principles: Life & Work,” in which he details his management philosophies, personal experiences, and life lessons.
Top Buys
| Rank | Stock | Value |
|---|---|---|
| 1 |

iShares MSCI Taiwan ETF
EWT
|
+$141M |
| 2 |

iShares MSCI Brazil ETF
EWZ
|
+$141M |
| 3 |

State Street SPDR S&P 500 ETF Trust
SPY
|
+$76.7M |
| 4 |
ALXN
Alexion Pharmaceuticals
ALXN
|
+$50.2M |
| 5 |

Bath & Body Works
BBWI
|
+$38.9M |
Top Sells
| Rank | Stock | Value |
|---|---|---|
| 1 |

iShares MSCI Emerging Markets ETF
EEM
|
+$543M |
| 2 |

Vanguard FTSE Emerging Markets ETF
VWO
|
+$420M |
| 3 |

iShares Core MSCI Emerging Markets ETF
IEMG
|
+$299M |
| 4 |

iShares TIPS Bond ETF
TIP
|
+$119M |
| 5 |

iShares JPMorgan USD Emerging Markets Bond ETF
EMB
|
+$52.1M |
Sector Composition
| Rank | Sector | Weight |
|---|---|---|
| 1 | Miscellaneous | 78.9% |
| 2 | Consumer Discretionary | 4.52% |
| 3 | Healthcare | 3.3% |
| 4 | Financials | 3.21% |
| 5 | Energy | 2.66% |
| Name | Market Value | Portfolio Weight | Shares or Principal |
Change in Stake | Capital Flow | Held Since | |
|---|---|---|---|---|---|---|---|
|
1
State Street SPDR S&P 500 ETF Trust
SPY
$783B
| $2.09B | 18.35% |
7,038,466
+259,530
| +4% | +$76.7M |
2013 Q2
25 quarters
|
|
|
2
Vanguard FTSE Emerging Markets ETF
VWO
$116B
| $1.5B | 13.22% |
37,380,069
-10,174,208
| -21% | -$420M |
2013 Q2
25 quarters
|
|
|
3
iShares Core MSCI Emerging Markets ETF
IEMG
$141B
| $848M | 7.45% |
17,300,739
-6,029,547
| -26% | -$299M |
2016 Q3
12 quarters
|
|

4
iShares Core S&P 500 ETF
IVV
$858B
| $653M | 5.74% |
2,188,003
+1,086
| +0% | +$323K |
2013 Q2
25 quarters
|
|

5
SPDR Gold Trust
GLD
$129B
| $563M | 4.95% |
4,056,627
| – | – |
2017 Q2
9 quarters
|
|
|
6
iShares MSCI Brazil ETF
EWZ
$8.49B
| $535M | 4.7% |
12,690,361
+3,259,767
| +35% | +$141M |
2016 Q1
14 quarters
|
|
|
7
iShares MSCI Emerging Markets ETF
EEM
$27.3B
| $513M | 4.51% |
12,564,214
-13,142,424
| -51% | -$543M |
2013 Q2
25 quarters
|
|

8
iShares iBoxx $ Investment Grade Corporate Bond ETF
LQD
$32.9B
| $297M | 2.61% |
2,331,734
-303,260
| -12% | -$38.2M |
2013 Q2
25 quarters
|
|

9
iShares 20+ Year Treasury Bond ETF
TLT
$46.5B
| $273M | 2.4% |
1,908,898
-93,399
| -5% | -$13M |
2017 Q2
9 quarters
|
|

10
iShares iBoxx $ High Yield Corporate Bond ETF
HYG
$18.1B
| $267M | 2.35% |
3,065,192
-158,382
| -5% | -$13.8M |
2016 Q2
13 quarters
|
|

11
iShares MSCI South Korea ETF
EWY
$19.9B
| $200M | 1.76% |
3,545,470
-24,240
| -0.7% | -$1.34M |
2016 Q3
12 quarters
|
|

12
iShares MSCI EAFE ETF
EFA
$76.2B
| $177M | 1.56% |
2,714,309
+147,323
| +6% | +$9.49M |
2017 Q2
9 quarters
|
|

13
Vanguard FTSE Developed Markets ETF
VEA
$225B
| $176M | 1.54% |
4,277,546
+232,492
| +6% | +$9.49M |
2017 Q2
9 quarters
|
|

14
iShares Gold Trust
IAU
$57.3B
| $165M | 1.45% |
5,839,928
| – | – |
2017 Q2
9 quarters
|
|

15
iShares Core MSCI EAFE ETF
IEFA
$189B
| $163M | 1.43% |
2,670,507
+157,261
| +6% | +$9.49M |
2017 Q2
9 quarters
|
|
|
16
iShares JPMorgan USD Emerging Markets Bond ETF
EMB
$13.8B
| $152M | 1.34% |
1,341,829
-457,952
| -25% | -$52.1M |
2017 Q2
9 quarters
|
|
|
17
iShares MSCI Taiwan ETF
EWT
$8.83B
| $145M | 1.28% |
+3,996,522
| New | +$141M |
2019 Q3
0 quarters
|
|

18
iShares MSCI India ETF
INDA
$6.86B
| $123M | 1.08% |
3,655,387
+649,311
| +22% | +$21.4M |
2019 Q1
2 quarters
|
|

19
Bread Financial
BFH
$3.68B
| $72.6M | 0.64% |
710,256
+29,175
| +4% | +$3.29M |
2015 Q3
16 quarters
|
|

20
Biogen
BIIB
$37.2B
| $55.3M | 0.49% |
237,455
-11,478
| -5% | -$2.67M |
2018 Q1
6 quarters
|
|

21
Alibaba
BABA
$226B
| $53.8M | 0.47% |
321,777
+7,854
| +3% | +$1.35M |
2018 Q2
5 quarters
|
|
|
22
Bath & Body Works
BBWI
$3.9B
| $53.4M | 0.47% |
3,374,212
+2,203,862
| +188% | +$38.9M |
2018 Q4
3 quarters
|
|

23
Macy's
M
$6.24B
| $52.7M | 0.46% |
3,390,903
+1,318,123
| +64% | +$24.4M |
2018 Q3
4 quarters
|
|

24
Ralph Lauren
RL
$22.9B
| $48M | 0.42% |
503,248
+311,558
| +163% | +$30.8M |
2016 Q4
11 quarters
|
|
|
XEC
25
DELISTED
Cimarex Energy
XEC
| $46.8M | 0.41% |
976,604
+215,327
| +28% | +$10.2M |
2016 Q2
13 quarters
|
|
Similar funds







Ray Dalio's Q3 2019 Portfolio in Review
As of Q3 2019, Ray Dalio held 415 positions worth $11.4B, down 11% from $12.8B the previous quarter. Its ten largest holdings account for 66% of the portfolio.
Ray Dalio withdrew a net $1.1B in Q3 2019, closing 82 positions and reducing 89 holdings. Its most notable exit was Bed Bath & Beyond, an estimated $42.5M position sold in full.
By sector, the portfolio is most concentrated in Miscellaneous at 79% of assets, down from 80% a quarter earlier, followed by Consumer Discretionary and Healthcare.
Against the trend, Ray Dalio opened a new position in iShares MSCI Taiwan ETF worth $145M.
- Ray Dalio's largest Q3 2019 buy was iShares MSCI Taiwan ETF: 3,996,522 shares worth $145M.
- Ray Dalio added most to iShares MSCI Brazil ETF in Q3 2019, an estimated $141M increase.
- Ray Dalio's biggest Q3 2019 reduction was iShares MSCI Emerging Markets ETF, cutting an estimated $543M.
- Ray Dalio fully exited Bed Bath & Beyond in Q3 2019, selling an estimated $42.5M.
- Ray Dalio's ten largest holdings make up 66% of its $11.4B portfolio in Q3 2019.
- Ray Dalio opened 110 new positions and closed 82 in Q3 2019.
- Ray Dalio's portfolio value fell 11% quarter-over-quarter to $11.4B.
Based on Bridgewater Associates's 13F filing for Q3 2019, filed 13 Nov 2019.