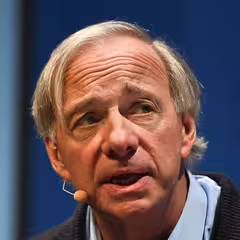
Ray Dalio Bridgewater Associates
Ray Dalio is the founder of Bridgewater Associates, one of the world’s largest hedge funds, known for its unique “principles-based” culture and systematic investment approach. Dalio’s investment philosophy emphasizes diversified portfolios, risk parity, and the importance of understanding economic cycles in shaping investment decisions. He has authored several books, including “Principles: Life & Work,” in which he details his management philosophies, personal experiences, and life lessons.
Top Buys
| Rank | Stock | Value |
|---|---|---|
| 1 |

iShares Core S&P 500 ETF
IVV
|
+$380M |
| 2 |

iShares MSCI South Korea ETF
EWY
|
+$171M |
| 3 |

iShares Core MSCI Emerging Markets ETF
IEMG
|
+$146M |
| 4 |
XEC
CIMAREX ENERGY CO
XEC
|
+$84.8M |
| 5 |

Bread Financial
BFH
|
+$78.5M |
Top Sells
| Rank | Stock | Value |
|---|---|---|
| 1 |

iShares MSCI Brazil ETF
EWZ
|
+$133M |
| 2 |

State Street SPDR S&P 500 ETF Trust
SPY
|
+$92.5M |
| 3 |

iShares MSCI Taiwan ETF
EWT
|
+$37M |
| 4 |

Toll Brothers
TOL
|
+$33.7M |
| 5 |

Newfield Exploration
NFX
|
+$24.9M |
Sector Composition
| Rank | Sector | Weight |
|---|---|---|
| 1 | Miscellaneous | 70.1% |
| 2 | Financials | 5.66% |
| 3 | Consumer Discretionary | 4.57% |
| 4 | Energy | 3.57% |
| 5 | Healthcare | 3.01% |
| Name | Market Value | Portfolio Weight | Shares or Principal |
Change in Stake | Capital Flow | Held Since | |
|---|---|---|---|---|---|---|---|

1
Vanguard FTSE Emerging Markets ETF
VWO
$119B
| $1.94B | 17.71% |
50,810,727
+48,891
| +0.1% | +$1.89M |
2013 Q2
22 quarters
|
|
|
2
State Street SPDR S&P 500 ETF Trust
SPY
$800B
| $1.88B | 17.17% |
7,506,685
-343,193
| -4% | -$92.5M |
2013 Q2
22 quarters
|
|
|
3
iShares Core MSCI Emerging Markets ETF
IEMG
$146B
| $679M | 6.21% |
14,396,289
+3,026,243
| +27% | +$146M |
2016 Q3
9 quarters
|
|
|
4
iShares Core S&P 500 ETF
IVV
$876B
| $555M | 5.08% |
2,205,905
+1,400,912
| +174% | +$380M |
2013 Q2
22 quarters
|
|

5
SPDR Gold Trust
GLD
$130B
| $474M | 4.34% |
3,908,999
| – | – |
2017 Q2
6 quarters
|
|

6
iShares MSCI Emerging Markets ETF
EEM
$28.2B
| $338M | 3.09% |
8,658,900
+721,728
| +9% | +$28.9M |
2013 Q2
22 quarters
|
|

7
iShares iBoxx $ Investment Grade Corporate Bond ETF
LQD
$32.9B
| $283M | 2.59% |
2,508,781
+6,647
| +0.3% | +$747K |
2013 Q2
22 quarters
|
|

8
iShares 20+ Year Treasury Bond ETF
TLT
$46.4B
| $237M | 2.17% |
1,954,452
-19,397
| -1% | -$2.25M |
2017 Q2
6 quarters
|
|
|
9
iShares MSCI South Korea ETF
EWY
$20.7B
| $195M | 1.78% |
3,312,243
+2,826,180
| +581% | +$171M |
2016 Q3
9 quarters
|
|

10
iShares iBoxx $ High Yield Corporate Bond ETF
HYG
$18.1B
| $194M | 1.77% |
2,386,220
-131,943
| -5% | -$11M |
2016 Q2
10 quarters
|
|

11
iShares JPMorgan USD Emerging Markets Bond ETF
EMB
$13.9B
| $183M | 1.67% |
1,759,993
-2,029
| -0.1% | -$212K |
2017 Q2
6 quarters
|
|

12
iShares MSCI EAFE ETF
EFA
$77.3B
| $144M | 1.32% |
2,448,104
| – | – |
2017 Q2
6 quarters
|
|

13
Vanguard FTSE Developed Markets ETF
VEA
$229B
| $143M | 1.31% |
3,865,979
| – | – |
2017 Q2
6 quarters
|
|

14
iShares Gold Trust
IAU
$57.5B
| $139M | 1.27% |
5,657,893
| – | – |
2017 Q2
6 quarters
|
|

15
iShares Core MSCI EAFE ETF
IEFA
$192B
| $131M | 1.2% |
2,386,437
| – | – |
2017 Q2
6 quarters
|
|

16
iShares TIPS Bond ETF
TIP
$14.3B
| $115M | 1.05% |
1,046,976
-73,208
| -7% | -$7.99M |
2017 Q2
6 quarters
|
|
|
17
Bread Financial
BFH
$3.74B
| $74.8M | 0.68% |
624,728
+500,472
| +403% | +$78.5M |
2015 Q3
13 quarters
|
|
|
XEC
18
DELISTED
CIMAREX ENERGY CO
XEC
| $68.2M | 0.62% |
1,105,795
+1,032,740
| +1,414% | +$84.8M |
2016 Q2
10 quarters
|
|

19
DELISTED
US Steel
X
| $66.9M | 0.61% |
3,669,907
+2,577,444
| +236% | +$64.5M |
2017 Q3
5 quarters
|
|

20
International Paper
IP
$18.2B
| $59.7M | 0.55% |
1,562,715
+1,384,739
| +778% | +$58.1M |
2018 Q1
3 quarters
|
|

21
LyondellBasell Industries
LYB
$20.8B
| $58.6M | 0.54% |
705,062
+506,301
| +255% | +$46.3M |
2018 Q1
3 quarters
|
|

22
United Rentals
URI
$69.6B
| $57.1M | 0.52% |
556,753
+469,542
| +538% | +$56.5M |
2013 Q2
22 quarters
|
|
|
CELG
23
DELISTED
Celgene Corp
CELG
| $56.3M | 0.52% |
878,145
+452,119
| +106% | +$33.4M |
2017 Q1
7 quarters
|
|

24
AT&T
T
$149B
| $55.2M | 0.51% |
2,560,796
+1,320,381
| +106% | +$30.7M |
2017 Q1
7 quarters
|
|

25
PVH
PVH
$4.31B
| $48.2M | 0.44% |
518,131
+399,903
| +338% | +$45.8M |
2018 Q3
1 quarter
|
|
Similar funds








Ray Dalio's Q4 2018 Portfolio in Review
As of Q4 2018, Ray Dalio held 528 positions worth $10.9B, up 13% from $9.7B the previous quarter. Its ten largest holdings account for 62% of the portfolio.
Ray Dalio deployed $2.53B of net new capital in Q4 2018, opening 174 new positions and adding to 210 existing holdings. Its largest new stake was Eastman Chemical: 624,555 shares worth $45.7M.
By sector, the portfolio is most concentrated in Miscellaneous at 70% of assets, down from 81% a quarter earlier, followed by Financials and Consumer Discretionary.
On the sell side, the largest reduction was iShares MSCI Brazil ETF, an estimated $133M trimmed.
- Ray Dalio's largest Q4 2018 buy was Eastman Chemical: 624,555 shares worth $45.7M.
- Ray Dalio added most to iShares Core S&P 500 ETF in Q4 2018, an estimated $380M increase.
- Ray Dalio's biggest Q4 2018 reduction was iShares MSCI Brazil ETF, cutting an estimated $133M.
- Ray Dalio fully exited iShares MSCI Taiwan ETF in Q4 2018, selling an estimated $37M.
- Ray Dalio's ten largest holdings make up 62% of its $10.9B portfolio in Q4 2018.
- Ray Dalio opened 174 new positions and closed 56 in Q4 2018.
- Ray Dalio's portfolio value rose 13% quarter-over-quarter to $10.9B.
Based on Bridgewater Associates's 13F filing for Q4 2018, filed 13 Feb 2019.