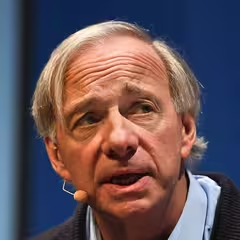
Ray Dalio Bridgewater Associates
Ray Dalio is the founder of Bridgewater Associates, one of the world’s largest hedge funds, known for its unique “principles-based” culture and systematic investment approach. Dalio’s investment philosophy emphasizes diversified portfolios, risk parity, and the importance of understanding economic cycles in shaping investment decisions. He has authored several books, including “Principles: Life & Work,” in which he details his management philosophies, personal experiences, and life lessons.
Top Buys
| Rank | Stock | Value |
|---|---|---|
| 1 |

iShares MSCI Emerging Markets ETF
EEM
|
+$1.2B |
| 2 |

Vanguard FTSE Emerging Markets ETF
VWO
|
+$388M |
| 3 |

State Street SPDR S&P 500 ETF Trust
SPY
|
+$144M |
| 4 |

iShares Core MSCI Emerging Markets ETF
IEMG
|
+$58.6M |
| 5 |

Apple
AAPL
|
+$23.9M |
Top Sells
| Rank | Stock | Value |
|---|---|---|
| 1 |

Barrick Mining
B
|
+$45.1M |
| 2 |

Cencora
COR
|
+$18.6M |
| 3 |
GG
Goldcorp Inc
GG
|
+$17.8M |
| 4 |

Bread Financial
BFH
|
+$17.5M |
| 5 |

MetLife
MET
|
+$16.5M |
Sector Composition
| Rank | Sector | Weight |
|---|---|---|
| 1 | Miscellaneous | 82.9% |
| 2 | Technology | 3.63% |
| 3 | Energy | 3.36% |
| 4 | Consumer Discretionary | 2.37% |
| 5 | Healthcare | 2.07% |
| Name | Market Value | Portfolio Weight | Shares or Principal |
Change in Stake | Capital Flow | Held Since | |
|---|---|---|---|---|---|---|---|
|
1
Vanguard FTSE Emerging Markets ETF
VWO
$123B
| $3.03B | 29.79% |
80,412,854
+10,411,665
| +15% | +$388M |
2013 Q2
13 quarters
|
|
|
2
iShares MSCI Emerging Markets ETF
EEM
$29.5B
| $2.66B | 26.18% |
70,996,740
+32,804,907
| +86% | +$1.2B |
2013 Q2
13 quarters
|
|
|
3
State Street SPDR S&P 500 ETF Trust
SPY
$824B
| $2.35B | 23.19% |
10,887,300
+666,100
| +7% | +$144M |
2013 Q2
13 quarters
|
|

4
iShares MSCI Brazil ETF
EWZ
$13.6B
| $154M | 1.52% |
4,573,811
+416,600
| +10% | +$13.8M |
2016 Q1
2 quarters
|
|

5
iShares iBoxx $ Investment Grade Corporate Bond ETF
LQD
$28.9B
| $113M | 1.12% |
919,855
+22,300
| +2% | +$2.75M |
2013 Q2
13 quarters
|
|
|
6
iShares Core MSCI Emerging Markets ETF
IEMG
$153B
| $60.2M | 0.59% |
+1,319,320
| New | +$58.6M |
2016 Q3
0 quarters
|
|

7
Intel
INTC
$491B
| $57.5M | 0.57% |
1,523,043
+535,000
| +54% | +$18.9M |
2013 Q2
13 quarters
|
|
|
8
Apple
AAPL
$5.02T
| $39.2M | 0.39% |
1,386,400
+901,600
| +186% | +$23.9M |
2013 Q2
13 quarters
|
|

9
iShares Core S&P 500 ETF
IVV
$892B
| $38.1M | 0.37% |
175,000
| – | – |
2013 Q2
13 quarters
|
|

10
Microsoft
MSFT
$3.96T
| $35.9M | 0.35% |
623,548
+324,500
| +109% | +$18.3M |
2013 Q4
11 quarters
|
|
|
ESRX
11
DELISTED
Express Scripts Holding Company
ESRX
| $28.4M | 0.28% |
403,218
+91,600
| +29% | +$6.85M |
2013 Q2
13 quarters
|
|

12
Suncor Energy
SU
$92.4B
| $27.6M | 0.27% |
996,900
+188,100
| +23% | +$5.14M |
2013 Q2
13 quarters
|
|

13
Cisco
CSCO
$423B
| $27.3M | 0.27% |
859,590
+491,600
| +134% | +$15.1M |
2015 Q1
6 quarters
|
|

14
DELISTED
Juniper Networks
JNPR
| $26.1M | 0.26% |
1,085,556
+214,547
| +25% | +$4.97M |
2013 Q3
12 quarters
|
|

15
Gilead Sciences
GILD
$190B
| $24.9M | 0.25% |
315,272
-59,400
| -16% | -$4.83M |
2013 Q4
11 quarters
|
|

16
Applied Materials
AMAT
$325B
| $22.3M | 0.22% |
738,683
+269,100
| +57% | +$7.51M |
2016 Q1
2 quarters
|
|

17
Pfizer
PFE
$170B
| $21.2M | 0.21% |
660,161
+69,247
| +12% | +$2.32M |
2015 Q2
5 quarters
|
|

18
Bristol-Myers Squibb
BMY
$125B
| $21.1M | 0.21% |
390,577
+204,123
| +109% | +$13.1M |
2015 Q3
4 quarters
|
|

19
DELISTED
Noble Corporation
NE
| $21M | 0.21% |
3,308,530
+1,054,418
| +47% | +$7.09M |
2014 Q4
7 quarters
|
|

20
Canadian Natural Resources
CNQ
$112B
| $20.8M | 0.21% |
1,333,669
+231,563
| +21% | +$3.52M |
2013 Q2
13 quarters
|
|

21
Texas Instruments
TXN
$260B
| $20.5M | 0.2% |
291,781
+99,400
| +52% | +$6.78M |
2013 Q2
13 quarters
|
|

22
DELISTED
Southwestern Energy Company
SWN
| $20.1M | 0.2% |
+1,449,623
| New | +$20.1M |
2016 Q3
0 quarters
|
|

23
United Rentals
URI
$66.5B
| $19.8M | 0.2% |
252,630
+41,354
| +20% | +$3.17M |
2013 Q2
13 quarters
|
|
|
24
Bread Financial
BFH
$4.17B
| $18.2M | 0.18% |
106,594
-102,972
| -49% | -$17.5M |
2015 Q3
4 quarters
|
|
|
ENDP
25
DELISTED
Endo International plc
ENDP
| $17.9M | 0.18% |
+887,293
| New | +$17.6M |
2016 Q3
0 quarters
|
|
Similar funds







Ray Dalio's Q3 2016 Portfolio in Review
As of Q3 2016, Ray Dalio held 430 positions worth $10.2B, up 27% from $7.98B the previous quarter. Its ten largest holdings account for 84% of the portfolio.
Ray Dalio deployed $1.72B of net new capital in Q3 2016, opening 90 new positions and adding to 107 existing holdings. Its largest new stake was iShares Core MSCI Emerging Markets ETF: 1,319,320 shares worth $60.2M.
By sector, the portfolio is most concentrated in Miscellaneous at 83% of assets, up from 78% a quarter earlier, followed by Technology and Energy.
On the sell side, the largest reduction was Cencora, an estimated $18.6M trimmed.
- Ray Dalio's largest Q3 2016 buy was iShares Core MSCI Emerging Markets ETF: 1,319,320 shares worth $60.2M.
- Ray Dalio added most to iShares MSCI Emerging Markets ETF in Q3 2016, an estimated $1.2B increase.
- Ray Dalio's biggest Q3 2016 reduction was Cencora, cutting an estimated $18.6M.
- Ray Dalio fully exited Barrick Mining in Q3 2016, selling an estimated $45.1M.
- Ray Dalio's ten largest holdings make up 84% of its $10.2B portfolio in Q3 2016.
- Ray Dalio opened 90 new positions and closed 131 in Q3 2016.
- Ray Dalio's portfolio value rose 27% quarter-over-quarter to $10.2B.
Based on Bridgewater Associates's 13F filing for Q3 2016, filed 9 Nov 2016.