What is peer comparison?
One of the most popular and well-acknowledged methods of equities analysis utilized by both professional analysts and retail investors is peer comparison. It has proven to be quick and accurate, identifying which stocks might be overvalued and which might be ideal additions to a portfolio.
Peer comparison research continues to be a crucial tool for identifying inexpensive stocks, even though other techniques, like discounted cash flow or technical analysis, can be used to determine whether a stock is worth buying. Continue reading to find out how peer comparison works and how it compares to other analysis techniques.
Is comparing a stock to its peers important?
As an investor in the twenty-first century, you have a variety of possibilities. There are numerous investing possibilities available in each area, even if you favor equity investments. The days of monopoly are over. Within the same industry, there are many market participants. The management has grown more proactive as a result of the rising competition. Comparing stocks from the same industry in such a situation might assist you in making the best investment decision.
How do you compare stocks?
There are two approaches to stock analysis.
1. Ratio Analysis (Quantitative)
Ratio analysis discusses calculating the key ratios that represent the stock's fundamentals for you. These include metrics like the return on equity (ROE), price to earnings (P/E), debt to equity (D/E), and leverage, among others.
When you have calculated the stock's ratios, you can compare them to the ratios of other stocks in the same sector.
Relative Valuation
Relative valuation, which is typically the first step in a peer comparison study, is a way of valuing a company by comparing standardized value metrics with those of similar companies. Actually, it's fairly easy: To begin, select pertinent ratios, such as price-to-earnings (P/E), price-to-sales (P/S), enterprise value/EBITDA (EV/EBITDA), or others that you think pertinent to the investment decision. Next, locate these ratios for each company in the peer group and compare them to the others.
Other companies in the same industry frequently make up the peer group, but peers can also be selected depending on the firm's specific characteristics, such as its stage in the life cycle. The quick-service restaurant sector's relative valuations are displayed in Figure 1 below.
Name | Ticker | P/E | P/S | EV/EBITDA |
McDonald's Corp | MCD | 36 | 8.8 | 22.0 |
Yum! Brands Inc. | YUM | 38 | 6.0 | 25.3 |
Wendy's International Inc. | WEN | 41 | 2.8 | 15.3 |
Average | n/a | 38.3 | 5.9 | 20.9 |
Figure 1, as of 2020
The majority of valuation measures are simple to calculate, thus the question is how a company's measurements should compare to those of its competitors. In other words, should the company differ from the industry average's valuation by higher or lower, and by how much?
One firm, Chipotle Mexican Grill, is valued at much higher multiples than the rest of the group by all three valuation metrics among the companies mentioned in Figure 1. If all of the companies utilized for comparison were valued similarly based only on these parameters, we would naturally desire to sell Chipotle (or at least avoid buying it). However, this straightforward analysis may be flawed since we must presume that each company should be evaluated differently in light of its particular set of conditions.
The group is used to calculate average valuations, but after that, we must decide how each company should be valued in relation to the others. In order to achieve this, we measure the qualitative characteristics of the concerned organizations using instruments like leverage and profitability indicators.
Leverage and Profitability Metrics
Leverage and profitability measures by themselves won't reveal a company's fair value when using peer comparison research, but they can show an investor how a company should be valued in relation to its competitors.
Indicating that Company X may not convert money into profits as quickly as its rivals, Company X should be valued at a lower multiple than its peers if you know that it has a return on equity (ROE) of 10% while the rest of its near competitors have an ROE of 15%.
Of course, before deciding how a company compares to its peers, an investor should consider a number of metrics, including ROE, return on equity (ROE), return on assets (ROA), gross margin, operating margin, profit margin, debt/equity ratio, and others that may be pertinent for a firm's specific circumstances or industry.
The companies in question's anticipated growth rates are also quite important. A company could be valued at much greater multiples than its competitors if it has even little higher expected profit growth. Though predicted profit growth is ultimately the key consideration, fledgling businesses and sectors may also give significant weight to expected sales growth because they may not become profitable for some time.
Name | Ticker | ROE | ROA | Gross Margin | Operating Margin | Profit Margin | Debt/ Equity | Expected Annual Earnings Growth |
McDonald's Corp. | MCD | 302% | 9% | 51% | 38% | 25% | 0.2 | 18% |
Yum! Brands Inc. | YUM | n/a | 15% | 48% | 29% | 16% | 0.3 | 13% |
Wendy's International Inc. | WEN | 24% | 2% | 36% | 17% | 7% | 0.5 | 15% |
Average | -- | 163% | 9% | 45% | 28% | 16% | 0.3 | 15% |
Figure 2, as of 2020
Figure 2 illustrates the wide range of KPIs for quick-service restaurants. Better efficiency and/or operational conditions are indicated by greater ROE, ROA, gross margin, operating margin, and profit margin. This will improve valuation. Due to increased leverage and consequently lower valuation, a higher debt-to-equity ratio denotes greater risk.
The most crucial metric, expected earnings growth, will typically have the biggest impact on valuation, and as we can see, Chipotle is indeed valued higher than the rest by P/E, P/S, and EV/EBITDA based on its current stock price. This is because Chipotle has much higher expected earnings growth than the industry average (see Figure 1). The only indicator in the above table that cannot be determined from the financial statements of the companies is expected earnings growth.
This earnings growth number in Figure 2 is derived from consensus analyst forecasts. Although it is possible for individual investors to create their own models of profit growth, considerable care should be made to maintain accurate estimations because this variable has a substantial impact on pricing.
Spotting Undervalued Stocks
The next stage is to identify undervalued stocks by combining these measures with current valuation ratios. To accomplish this, examine the leverage, profitability, and other pertinent variables in an effort to identify the companies that should be valued higher than the industry average, and then compare those forecasts with the market's actual valuations. This research suggests that if the current valuation is less than what seems acceptable, the security may represent a good buying opportunity.
This is rarely, though, as simple as it would seem. The majority of investors consider this method to be more of an art than a science, despite the fact that some utilize quantitative econometric research to attempt and accurately anticipate how a company should be priced based on its measurements. Qualitative considerations must also be taken into consideration.
2. Management and Business Analysis (Qualitative)
A business may appear to be successful on the outside, but its management may be hiding secrets that could cause your hard-earned money to be lost. Due to subpar management, equities like Satyam Computers and Yes Bank have crashed.
When contrasting them with other equities, you should look out for the following things to prevent this:
- Analyzing the management's goals and future company prospects is crucial.
- The openness of the management can be seen in the transparency of the decision-making process.
- You can consult the Annual Reports that are accessible on the business website. The management's intentions and upcoming projects are covered separately in this report.
- CSR initiatives might reveal a management team's sincerity.
- Investments are better with companies that adhere to ESG
.
Qualitative Factors
Based on variables outside of their financial accounts, some businesses are better or worse off than their competitors. Since every organization depends on its managers for leadership and vision, both of which can eventually have an impact on the bottom line, management quality is one of the qualitative factors that has received the most research.
The finest businesses will have a steady management team and a depth of expertise that allows them to weather the loss of one or two senior executives without suffering a significant setback to their business operations or overall strategy. Some variables aim to reduce the risks that investors are exposed to; for instance, corporate governance procedures are made to guarantee that shareholders' interests are protected.
Porter's five forces analysis is another widely used method for examining qualitative features. These are the five forces:
- A potential new arrival
- Threat of replacement
- Suppliers' negotiating power
- Buyer bargaining power
- Market competition in the sector where the company operates
The way these five forces combine can impact a company's long-term chances of success.
If a company is in a better or worse position than its competitors, it should be valued at a greater or lower multiple, just like leverage and profitability measures should be examined. After accounting for all of these measures and qualitative elements, the stock may be undervalued if the present valuation is less than what appears acceptable.
A comparison of the key ratios
The principles and ratio calculations might be challenging to comprehend, especially for investors without a background in business. These ratios can be easily found in numerous sources. The ratios for stocks and industry averages are available. All you need to do is analyze them and contrast them with other stocks. The essential ratios to compare are listed below, along with explanations of what they mean:
Price to Book Value (P/B)
The value of assets on a company's balance sheet is known as book value. Price is the stock's current market value. The P/B ratio reveals how much investors are ready to pay for a single share in relation to its book value.
- Greater than peers: The stock is overpriced or has some degree of monopoly.
- Lower than the peers: Either the stock is undervalued, or investors have less faith in the management's judgment.
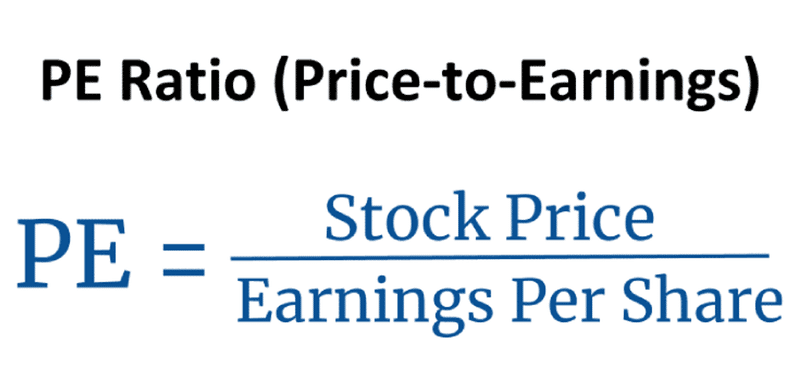
Price to Earnings per Share (P/E)
Earnings per Share is the term used to describe net profit after taxes (EPS). The P/E ratio reveals the multiple of earnings that investors are ready to pay for a single share.
- Greater than peers: Either the stock is overpriced or investors predict greater future profit growth.
- Lower than the peers: The stock is underpriced or investors have doubts about the company's potential for future financial success.
Debt to Equity (D/E)
Loans that a company has taken out from banks and other financial organizations are referred to as debt. The capital that shareholders invest is known as equity. Debt is less expensive and has no voting privileges. As a result, the company generates larger earnings.
As a result, companies opt to take on greater debt. Although a D/E ratio of 2:1 is ideal, different industries may have different requirements.
- Greater than peers: Investing in the company is too hazardous because it must give the lenders a sizable portion of its income. A legal obligation is to repay your loans on schedule. If the company experiences a loss, the loans must be repaid from the wealth of the shareholders.
- Lower than peers: Since there is little chance of a loan default, investing in the company carries a lower risk.
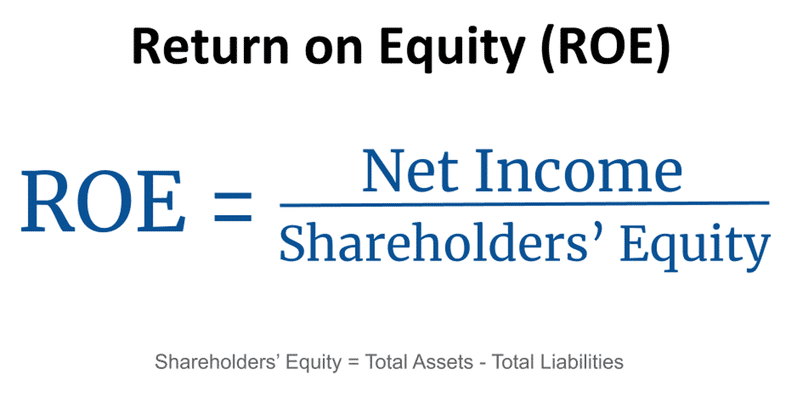
Return on Equity (ROE)
Net income is shown as a percentage of equity share capital's book value by return on equity. Let's say your company has a Rs. 1,000,000 net profit and a Rs. 10,000,000 share capital. So, ROE is equal to 10% [(1,000,00,000 / 10,00,000) times 100].
- Greater than peers: This indicates that the business is effectively using its capital. With less cash, the enterprise is producing higher profits.
- Lower than peers: This indicates that the company is not making efficient use of its capital.
Interest Coverage Ratio
This ratio demonstrates how frequently income can pay the cost of interest. EBIT (Earnings before Interest and Tax) / Interest Expense is the equation.
- Greater than peers: The business can easily cover the interest payments with its profits.
- Lower than peers: The business would have trouble covering interest expenses.
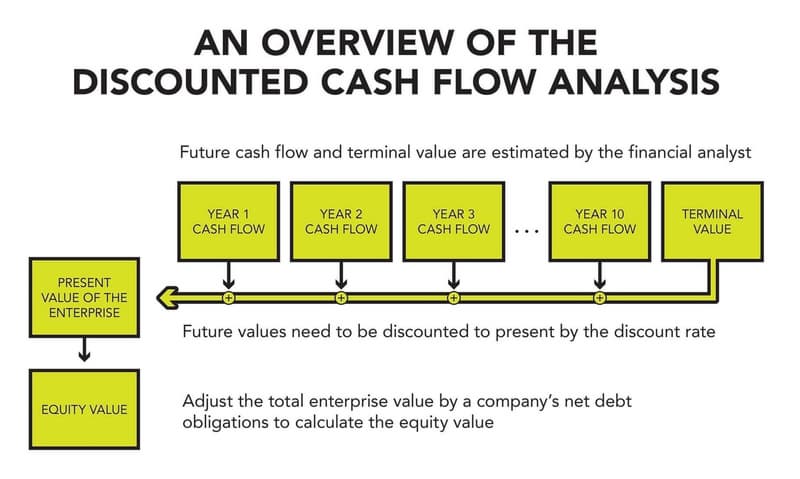
Discount cash flow analysis vs. Peer comparison
While we won't go into great detail on discounted cash flow analysis (DCF) here, one significant distinction between DCF and peer comparison methodologies should be made. Analysis of peer comparisons is predicated on the idea that peers are, on the whole, properly valued. If this is not the case, the entire sector could increase or fall, affecting all stocks.
A stock with the potential to outperform its peers might have been discovered by an investor using peer comparison to study the internet industry in 2000, but this reasoning would have been flawed because the stock's entire peer group was overvalued and fell sharply over the following few years. Because the industry was revalued at a lower overall valuation, any security that was deemed to be the most attractive at the time would likely still decline.
If properly applied, discounted cash flow is not vulnerable to this issue. Theoretically, this method can value a corporation without taking into account the value of its peers or even the wider market because DCF does not depend on how a firm is valued in relation to others. However, both approaches do need a great lot of discretion and judgment, and they must be carried out carefully in order to produce reliable results.
Summary
It's crucial to conduct thorough research on the firm while examining a stock. Even while the company's financial health is reflected in the financial records, you shouldn't discount the company's other competitive advantages. You won't get the complete picture unless you attempt to evaluate a company in relation to its competitors. The business continually competes with others in the industry in the real world of business as well. We could make better decisions if we considered all the necessary measures and compared all the factors. The appropriate stock you choose will determine whether you make money or lose it.
FAQ
How can a peer group be formed?
Step 1: List the companies that are involved in the same industry or sub-industry.
Step 2: Go over the company's annual report.
Step 3: Analyze the yearly reports of the rivals.
Step 4: Examine industry journals to identify any other competitors.
Step 5: Verify that the comparable companies' income sources are the same as those of the relevant firm.
How can you use relative strength to compare two stocks?
Calculating the relative strength comparison indicator requires dividing the price of one security by the price of another security. The ratio, or relationship, between the two securities, is the outcome of this division.
How can two stocks be compared?
Ratio analysis of the financial statements of each business is one of the best ways to compare two organizations. In order to determine the relationship between each number in the financial statements, a ratio analysis looks at different numbers in the statements, such as net profit or total expenses.
Is it important to compare stocks to their peers?
One of the most popular and well-acknowledged methods of equities analysis utilized by both professional analysts and retail investors is peer comparison. It has proven to be quick and accurate, identifying which stocks might be overvalued and which might be ideal additions to a portfolio.
What is an effective ratio to look at when comparing stocks?
Look at the company's price-to-earnings ratio, which compares the share price to earnings per share. You can find out how risky a stock is by looking at a company's beta in relation to the rest of the market. Invest in equities with a high yield if you want to put your cash in a safe place.