
Definition financial ratios
To obtain useful data about a company, financial ratios are constructed using numerical values collected from financial statements. Quantitative analysis is used to evaluate a company's liquidity, leverage, growth, margins, profitability, rates of return, valuation, and other factors using the data on its financial statements, which include the balance sheet, income statement, and cash flow statement.
Ratio categories
The following categories are used to classify financial ratios:
Liquidity Ratios
Financial measurements called liquidity ratios assess a company's capacity to pay off both short- and long-term debt.
Leverage Financial Ratios
Leverage ratios quantify the capital derived through debt. In other words, leverage financial ratios are employed to assess the quantity of debt held by an organization.
Efficiency Ratios
Efficiency ratios, often called activity financial ratios, are used to gauge how effectively a business is using its resources and assets.
Profitability Ratios
Profitability ratios gauge a company's capacity to make money in relation to sales, assets on the balance sheet, operational expenses, and equity.
Market Value Ratios
Market value ratios are used to assess a company's stock price per share.
Financial ratio analysis – how is it useful?
1. Tracks company performance
To identify trends that might be forming within a corporation, specific financial ratios are determined for each period and their changes over time are tracked. For instance, a rising debt-to-asset ratio may show that a business is heavily indebted and may eventually be at risk of default.
2. Make comparative judgments regarding company performance
It is possible to determine whether a company is performing better or worse than the industry average by comparing its financial ratios to those of its main competitors. An analyst or investor can identify which company is using its assets the most effectively by comparing the return on assets among different companies.
Both internal and external partners to the organization use financial ratios:
- External users: External users include financial analysts, small-scale investors, creditors, rivals, taxing and regulating bodies, and industry watchers.
- Internal users: The management group, personnel, and proprietors.
3. Examining the firms' operational effectiveness
We can analyze the level of firm efficiency with the aid of specific ratios. Such as the inventory turnover ratio, fixed asset turnover, and account receivables turnover ratio. These ratios can be compared to those of other companies in the same industry to determine which ones are handled better. It also gauges a company's ability to use its assets to create income. Third, it examines several characteristics of the company, such as how long it typically takes to recover money from creditors or how long it takes to convert inventory to cash. Because of this, efficiency ratios are important because they can increase profitability.
4. The firms' liquidity
Whether or not a corporation can meet its short-term obligations depends on its liquidity. We're talking about short-term commitments, short-term loans that can be settled in a year, or the operational cycle. For instance, unpaid salaries, various creditors, taxes, unpaid bills, etc. The liquidity of the firms is measured by the current and quick ratios.
5. Helps identify the company's business risks
The ability to better comprehend the company's business is one of the most crucial benefits of using ratio analysis. The firm can comprehend the business risk, or how the deployment of its fixed costs and outstanding debt affects its profitability, by calculating the leverages (financial leverage and operating leverage).
6. For the company's planning and future forecasting
By identifying trends, analysts and managers may help external stakeholders like investors make crucial decisions about the future. For instance, they can determine whether to invest in a project.
Types of financial ratios
1. Earnings Per Share (EPS)
The profit of a corporation is divided by the number of outstanding shares of its common stock to arrive at earnings per share (EPS). The resultant figure is used to gauge a company's profitability. It is typical for businesses to publish EPS that has been adjusted for unusual expenses and possible share dilution.
The more profitable a corporation is deemed to be, the greater its EPS.
How to Determine Earnings Per Share (EPS)
Net income, commonly referred to as profits or earnings, is computed as net income divided by the number of shares outstanding. The numerator and denominator are modified in a more complex computation to account for shares that might be produced by options, convertible debt, or warrants. If the equation's numerator is changed to account for ongoing processes, it becomes much more pertinent.

The balance sheet and income statement are used to determine the number of common shares outstanding at period-end, dividends paid on preferred stock (if any), and net income or earnings. Because the number of common shares can fluctuate over time, it is more accurate to utilize a weighted average for the reporting period.
The weighted average number of shares outstanding must take stock dividends and splits into account when determining how many shares are outstanding overall. The calculation may be made easier by some data sources by utilizing the total number of shares outstanding at the end of a period.
How is EPS useful?
One of the most crucial metrics used to assess a company's profitability on an absolute basis is earnings per share. It plays a significant role in determining the price-to-earnings (P/E) ratio, where the EPS is the "E" in P/E. An investor can determine the value of a stock in terms of how much the market is ready to pay for each dollar of earnings by dividing a company's share price by its earnings per share.
One of the various indicators you can use to choose stocks is EPS. Selecting a broker who suits your investment style is the next step if you're interested in stock trading or investing.
Because common shareholders do not have direct access to the earnings, comparing EPS in absolute terms may not signify much to investors. Instead, to assess the worth of earnings and how confident they are in future growth, investors will contrast EPS with the stock's share price.
2. Price-to-Earnings Ratio (P/E)
The ratio for valuing a firm that compares its current share price to its earnings per share is called the price-to-earnings ratio (EPS). The price multiple or earnings multiples are other names for the price-to-earnings ratio.
Investors and analysts use P/E ratios to assess the comparative value of a company's shares in an apples-to-apples comparison. It can also be used to compare a company to its past performance or to compare broad markets over time or to one another. P/E estimates can either be forecast or trailing (backward-looking).
Calculating P/E Ratio
The following formula and calculation are utilized in this process:
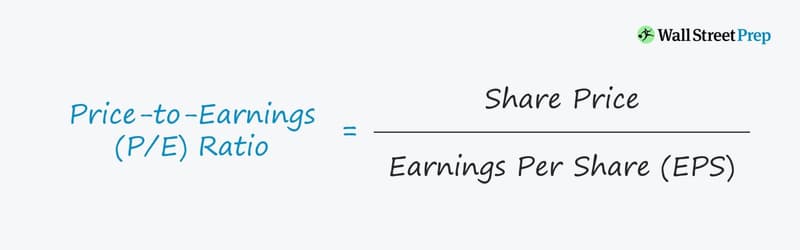
Simply divide the current stock price by the earnings per share (EPS) to get the P/E figure.
The current stock price (P) may be easily determined by entering a firm's ticker symbol into any finance website; however, although this actual metric shows the price that investors must currently pay for a stock, the EPS is a little less clear-cut.
There are two primary types of EPS. TTM stands for "trailing 12 months," according to Wall Street. This figure represents the business's performance over the last 12 months. The second kind of EPS can be seen in an organization's earnings report, which frequently offers EPS guidance. This represents the company's best-educated estimate of future earnings. These various EPS versions serve as the foundation for the trailing and forward P/E ratios, respectively.
How does P/E Ratio work?
One of the most popular methods for investors and analysts to estimate a stock's relative value is the price-to-earnings ratio (P/E). A stock's P/E ratio can be used to assess whether it is overvalued or undervalued. The P/E ratio of a firm can also be compared to other stocks in the same sector or to the whole market, such as the S&P 500 Index.
Occasionally, analysts who are interested in long-term valuation patterns will take into account the P/E 10 or P/E 30 metrics, which, respectively, average the last 10 or prior 30 years of earnings. These longer-term measurements can account for fluctuations in the business cycle, which is why they are frequently used when attempting to determine the overall value of stock indices like the S&P 500.
The S&P 500's P/E ratio has varied from a low of about 5x (in 1917) to more than 120x (in 2009 right before the financial crisis). The S&P 500's long-term average P/E is approximately 16x, which means that the index's constituent stocks are valued at a premium that is 16 times bigger than their weighted average earnings.
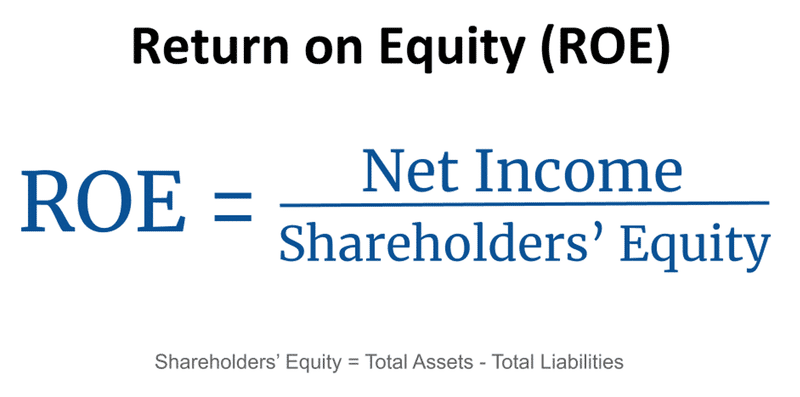
3. Return on equity (ROE)
A metric of financial performance known as return on equity (ROE) is obtained by dividing net income by shareholders' equity. ROE is referred to as the return on net assets since shareholders' equity is determined by subtracting a company's debt from its assets.
ROE is regarded as a barometer of a company's profitability and how well it produces profits. The management of a firm is more effective at generating income and growth from its equity financing the higher the ROE.
Calculating ROE
Calculating ROE Before dividends are given to common shareholders, after payouts to preferred shareholders, and before interest is paid to lenders, net income is computed.
Net income is the sum of a company's income, net expenses, and taxes for a specific time period. In order to compute average shareholders' equity, equity at the beginning of the period is added. The period shall start and conclude at the same time as the period in which the net income is earned.
The income statement includes net income for the most recent full fiscal year, often known as the trailing 12 months, which is a total of the financial activities during that time. The balance sheet, which is a running balance of all changes in a company's assets and liabilities over time, is where investors can find their equity.
Due to the discrepancy between the income statement and the balance sheet, it is deemed best practice to compute ROE using average equity over a period.
The relationship between ROE and stock performance
Assuming that the ratio is broadly in line with or slightly over the average for its peer group, ROE can be used to determine sustainable growth rates and dividend growth rates. Although there may be some difficulties, ROE can be a useful starting point for creating future projections of a stock's growth rate and dividend growth rate. These two formulas are functions of one another and can be used to compare businesses more easily.
By dividing the ROE by the company's retention ratio, one may calculate the future growth rate of a company. The percentage of net income that a corporation keeps or reinvests in order to support future growth is known as the retention ratio.
4. Debt-To-Capital Ratio
The debt-to-capital ratio serves as a gauge of the financial leverage of an organization. The interest-bearing debt of the corporation, including both short- and long-term liabilities, is divided by the total capital to determine the debt-to-capital ratio. All interest-bearing debt plus shareholders' equity, which may comprise securities like ordinary stock, preferred stock, and minority interests, is referred to as total capital.
All interest-bearing debt plus shareholders' equity, which may comprise securities like ordinary stock, preferred stock, and minority interests, is referred to as total capital.
Calculating the Debt-to-Capital Ratio

By dividing a company's total debt by its total capital, which is made up of both total debt and total shareholders' equity, the debt-to-capital ratio is determined.
How is the Debt-To-Capital Ratio useful?
Analysts and investors can gain a better understanding of a company's financial structure and determine whether or not it is a good investment by looking at its debt-to-capital ratio. If all else is equal, a corporation is riskier if its debt-to-capital ratio is larger. This is due to the fact that a higher ratio indicates that more of the company's funding comes from debt than from equity, which entails a higher obligation to repay debt and a higher risk of loan forfeiture if the debt is not paid on time.
However, a certain level of debt could be fatal for one business while scarcely affecting another. Because total capital measures debt as a proportion of capital rather than as a fixed cash number, it provides a more realistic view of the company's health.
5. Interest coverage ratio (ICR)
A debt and profitability measure called the interest coverage ratio is used to assess how easily a business can pay the interest on its existing debt. Divided by interest expense during a specific time period, a company's earnings before interest and taxes (EBIT) yield the interest coverage ratio.
The time's interest earned (TIE) ratio is another name for the interest coverage ratio. This method is frequently used by lenders, investors, and creditors to assess a company's riskiness in relation to its present debt or for potential future borrowing.
How does the interest coverage ratio work?
The number of quarters or fiscal years for which interest payments may be made using the company's existing earnings is referred to as the "coverage" in the interest coverage ratio. In plainer terms, it shows how many times the corporation can meet its financial obligations.
The equation is as follows:

The lower the ratio, the greater the company's debt-related costs are and the less cash it has available for other uses. A company's capacity to cover interest costs may be in doubt if its interest coverage ratio is only 1.5 or lower.
In order to weather any future, and maybe unforeseeable, financial crises, companies must have more earnings than necessary to pay interest. The return to shareholders is significantly influenced by a company's capacity to fulfill its interest commitments, which is a component of its solvency.
Interest coverage ratio – how important is it?
Any business must constantly and critically worry about making interest payments. When a corporation has trouble meeting its obligations, it can be forced to take on additional debt or use cash reserves, which would be much better invested in capital assets or kept on hand for emergencies.
While examining a single interest coverage ratio can provide valuable insight into a company's current financial situation, doing so across time can often provide a considerably more accurate picture of a company's status and trajectory.
Investors can determine if a company's interest coverage ratio is rising, falling, or has remained consistent by looking at it quarterly for, say, the last five years. This is a wonderful way to gauge a company's short-term financial health.
Additionally, to some extent, the acceptability of any specific ratio level depends on the observer. In exchange for charging the business a higher interest rate on its debt, certain banks or prospective bond buyers can be content with a less acceptable ratio.
6. Enterprise value to EBIT
The financial ratio known as the EBIT/EV multiple, or earnings before interest and taxes (EBIT) divided by enterprise value (EV), is used to calculate a company's "earnings yield."
Joel Greenblatt, a well-known value investor and professor at Columbia Business School, popularized the idea of using the EBIT/EV multiple as a proxy for earnings yield and value.
How does the EBIT/EV Multiple works?
A metric for valuing a corporation is called enterprise value (EV). Because EVs offer a clearer picture of a company's true value than is achievable when evaluating only market capitalization, investors frequently utilize EVs when comparing companies against one another for potential investments.
EBIT/EV multiple and EV/Sales are two ratios that investors can use to compare companies that include EV as a key component. The following formula can be used to determine a company's EV:

The EV result displays the sum of money required to purchase the entire business. Some EV calculations involve the addition of preferred shares and minority equity. Minority interest and preferred shares are unusual in the capital structure of the great majority of organizations. Consequently, EVs is typically computed without them.
Since EBIT/EV is meant to represent an earnings yield, a higher multiple is advantageous for investors. There is an inherent bias in favor of businesses with larger cash on hand and lower levels of debt. All things being equal, a corporation with a leveraged balance sheet is riskier than a company with less leverage. The company with more cash on hand and/or less debt will have a lower EV, which will result in a higher earnings yield.
Pros of EBIT/EV Multiple
Compared to more traditional profitability ratios like return on equity (ROE) or return on invested capital, the EBIT/EV ratio might offer a more accurate comparison (ROIC). Although the EBIT/EV ratio is not frequently employed, it does have a few significant benefits when comparing businesses.
First, using EBIT instead of net income (NI) as a measure of profitability eliminates the potential distortions caused by varying tax rates. Second, normalizing the effects of various capital structures through the use of EBIT/EV.
When comparing earnings yields, EBIT, according to Greenblatt, "allows us to place enterprises with varying amounts of debt and different tax rates on the same basis." He believes that the denominator should be EV because it includes both market capitalization and the value of the debt.
7. Operating margin
The operational margin calculates the profit an organization makes on each dollar of sales, after variable production costs, such as labor and raw materials, but before interest or taxes. It is computed by dividing operating income by net sales for a business. In general, higher ratios are preferable, showing that the business is effective in its operations and adept at converting sales into profits.
How does the operating margin work?
The operating margin of a business, also known as return on sales (ROS), is a reliable indicator of how well it is run and how effectively it produces profits from sales. Investors and lenders pay special attention to it because it illustrates the portion of revenues that can be used to cover non-operating expenses like paying interest.
Operating margins that are highly erratic are a key sign of business risk. The same is true for determining whether a company's performance has improved by examining its historical operating margins. Better managerial controls, more effective resource usage, better pricing, and more successful marketing can all increase operating profit.
The operational margin can be defined as the ratio of a company's profits from its main business to its total revenues. Investors can then determine if a company derives the majority of its revenue from its main businesses or from other sources, like an investment.
Calculating operating margin
The operating margin calculation is as follows:
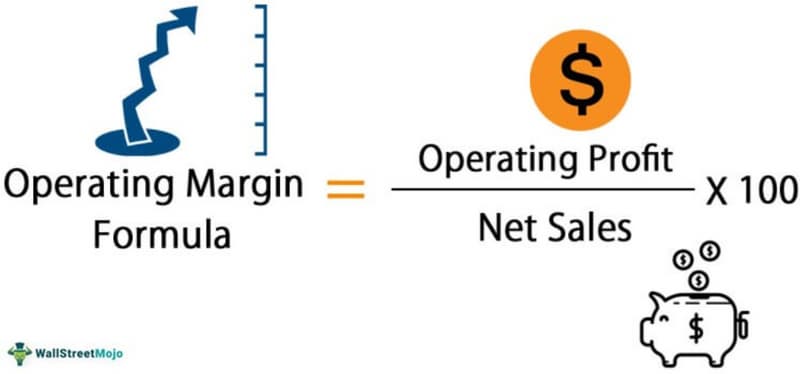
The numerator of an operating margin calculation is a company's earnings before interest and taxes (EBIT). Revenue less cost of goods sold (COGS) and the normal selling, general, and administrative costs of running a firm, excluding interest and taxes, is how operating earnings, also known as EBIT, are determined.
8. Quick ratio
The quick ratio assesses a company's capacity to satisfy its short-term obligations using its most liquid assets and serves as an indicator of its short-term liquidity position.
It is also known as the "acid test ratio" because it shows how quickly the corporation can use its near-cash assets (assets that can be swiftly converted to cash) to settle its present liabilities. A fast test intended to yield immediate findings is referred to as an "acid test" in slang.
How does quick ratio work?
The quick ratio compares a company's current obligations to its available liquid assets in terms of dollar value. Current liabilities are a company's debts or commitments that must be paid to creditors within a year, whereas liquid assets are those current assets that can be easily turned into cash with little impact on the price received on the open market.
A score of 1 is regarded as the typical rapid ratio. It means that the business has exactly the right amount of assets on hand to cover all of its immediate obligations. A company with a quick ratio below 1 might not be able to pay off all of its current liabilities in the near future, whereas a company with a fast ratio above 1 can pay off all of its current liabilities at once. A quick ratio of 1.5, for instance, means that a corporation has $1.50 in liquid assets to cover every $1 in current obligations.
While such ratios based on figures can shed light on a company's viability and certain of its facets, they could not give a full view of the company's overall health. To get the full picture of a company's financial health, it's crucial to include other related metrics.
The better a company's liquidity and financial health, the higher its quick ratio; however, to get a complete picture of a company's financial health, it's important to consider other related measures.
Calculating quick ratio
The quick ratio can be calculated in a few different ways. The most typical method is to multiply current liabilities by the sum of the most liquid assets:
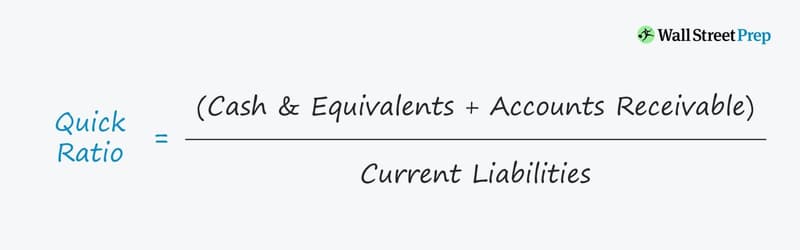
The most liquid current assets that are readily convertible to cash are referred to as quick assets.
A corporation may also determine quick assets by subtracting illiquid current assets from its balance sheet, depending on the kind of current assets it has. Because inventory and pre-paid expenses, for instance, might not be rapidly or easily converted to cash, a business might determine quick assets in the following way:
Quick Assets = TCA−Inventory−PE, where
- TCA = Total current assets
- PE = Prepaid expenses
Any method for calculating fast assets can be used to calculate current liabilities because all current liabilities are factored into the computation.
The Bottom Line
Companies can be compared using financial ratios. Investors might use them to assess the stocks in a particular sector. They can also offer a measurement of a business that can be compared to its past performance.
You can easily find the data you need to calculate ratios. The financial statements of a corporation contain all data. Once you have the raw data, you can use it to your advantage by plugging it into your financial analysis software.
Investors seek out resources that can provide them with an advantage. However, inexperienced investors typically misunderstand and steer clear of some of the best and possibly easiest-to-use tools.
Your confidence in your investment decisions might increase if you know what financial ratios mean and how to calculate them. This will also help you avoid common investing blunders.
FAQ
Why are financial ratios used by investors?
Financial ratios are a fantastic way to comprehend a company's likelihood of success. Different perspectives on a company's performance can be presented by ratios. To get a complete picture, it's a good idea to use multiple ratios rather than just one. Investors can choose whether or not to make an investment using these ratios and other data from additional research.
Can these ratios work as a comparison tool?
The same ratios for various companies can be examined by an investor to narrow down a list of potential investments. Alternately, one might compare the ratios for a few different businesses to the same ratio for the industry standard. Finally, to acquire a historical perspective on performance, it might be eye-opening to compare a ratio calculated lately to a similar ratio calculated over time for a single company. Additionally, you might evaluate historical ratio viewpoints for distinct organizations.
Investors have the chance to get detailed conclusions about potential investments through comparisons with financial ratios.
How are liquidity ratios useful?
The short-term liquidity of a company can be seen through liquidity ratios. They provide a window into a company's financial health. A good indication, for instance, is a positive current ratio. It denotes that a business has enough liquid assets to cover its short-term obligations.
On the other hand, a current ratio that is too high can show that a business may not be making the best use of its extra cash. Investors should consider whether there is an excess of cash that could be used to boost performance. If the ratio is high, should more current assets be invested to promote growth?
Is it better to have a higher or lower P/E ratio?
That depends on the qualities you want in an investment. A P/E ratio calculates the relationship between the price of a stock and its earnings per share. A stock that has a lower P/E ratio may be undervalued and thus be a good investment. It might, however, be low as a result of the company's poor financial standing.
A higher P/E can suggest that a stock is expensive, but that might just mean that the business is doing well and will probably keep doing so.
A relative value comparison tool for stocks you're interested in is frequently the best way to use P/E. Alternatively, you might want to assess the P/E of a few stocks in comparison to the industry standard.
What are the limitations of the debt-to-capital ratio?
The accounting practices adopted by a corporation may have an impact on its debt-to-capital ratio. Financial statement values are frequently based on historical cost accounting and may not accurately reflect current market values. In order to prevent the ratio from becoming distorted, it is crucial to ensure the calculation uses the correct quantities.


