
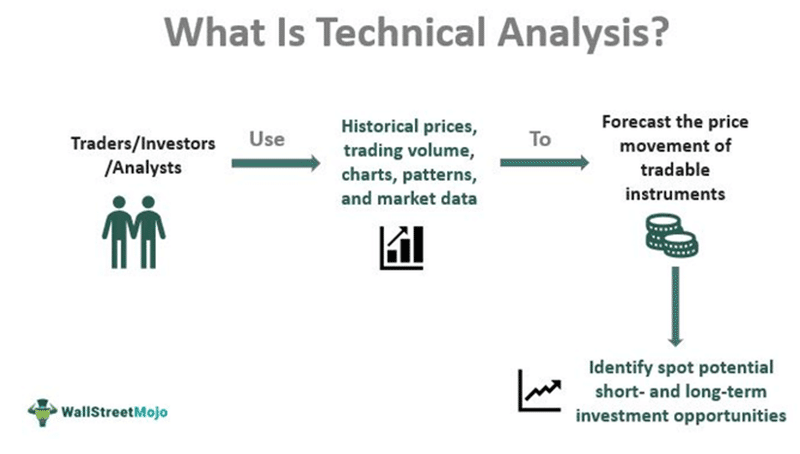
Defining Technical Analysis
Using technical analysis, one can learn about and choose which assets to buy and sell based on market activity. Contrastingly, the fundamental analysis seeks to base investment choices on a company's core competencies, including its revenue, profit margins, and other elements.
Examining patterns on stock charts, trade volume, price movements, and other indicators are all part of technical analysis. Technical analysts think that even if someone were to take in and evaluate all of the fundamental data about security, they still wouldn't be able to precisely forecast that security's future moves. All publicly available information eventually finds its way into a stock's price. Technical analysts contend that fundamental analysts cannot outperform since the stock price already takes into account all relevant fundamental data. Fundamental analysts seek to invest based on information that investors haven't taken into account when pricing shares.
According to technical analysts, it is more profitable to try to spot market trends and patterns. People's responses to the market and variations in trade volumes and pricing are what lead to these trends and patterns. As a result, they are likely to occur again, providing technical analysts with a chance to profit from these patterns.
People who use technical analysis generally believe that markets react logically to changes in fundamentals. Businesses that report rising revenues or profits typically see an increase in pricing, and vice versa. However, they also hold that technological patterns appear before changes brought on by fundamental shifts that are known to the public.
Technical analysis is a form of behavioral finance since it seeks to capitalize on the tendencies produced by human psychology, such as the propensity to think that items that are increasing in value will continue to increase in value or that patterns from the past will recur.
Understanding how Technical Analysis is used:
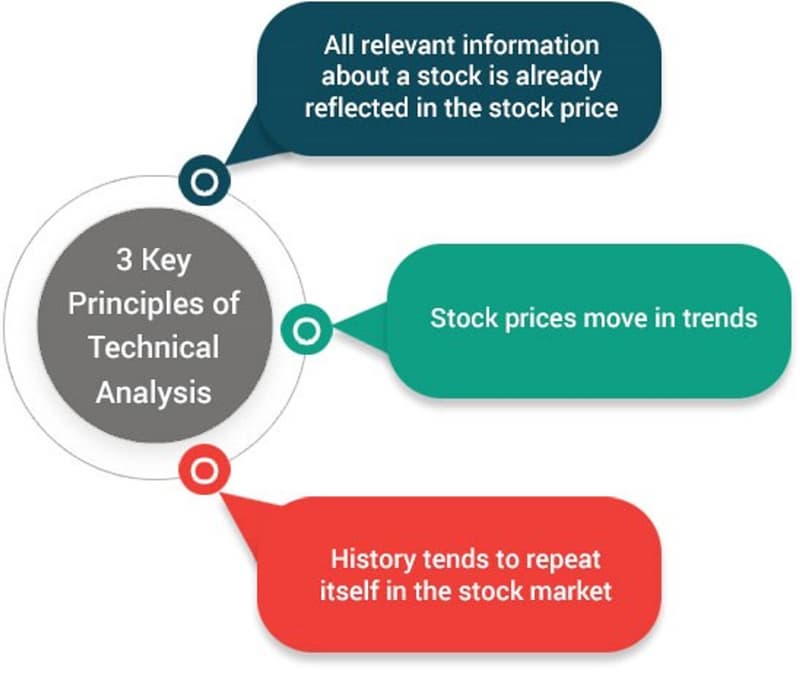
Three underlying presumptions guide technical analysis:
- All available information about a stock is promptly reflected in the market.
- Technical analysts can spot trends in price movement.
- Technical analysts can forecast future price changes by comparing current price patterns to historical ones because history has a tendency to repeat itself.
Technical analysts utilize their research to decide whether to purchase and sell shares in the near future based on these presumptions. Instead of investors creating a long-term portfolio, regular traders usually utilize it to guide their buying and sales.
A technical analyst might increase their stock purchases of a firm if positive technical signs are present. Negative signals may cause them to sell their shares or short (invest in a way that allows them to profit from declines in the value of their shares) a stock using options in an effort to profit from price drops.

The indicators of Technical Analysis
To help technical analysis trading, experts have created hundreds of patterns and signals that are used throughout the business. To forecast and trade on price fluctuations, technical analysts have created a wide variety of trading methods.
While some indicators are primarily concerned with detecting the current market trend, including support and resistance levels, others are more concerned with assessing a trend's strength and the chance that it will persist. Trendlines, channels, moving averages, and momentum indicators are among the frequently used technical indicators and chart patterns.
- Technical analysts typically examine the main categories of indicators below:
- Price trends
- Chart patterns
- Volume and momentum indicators
- Oscillators
- Moving averages
- Support and resistance levels
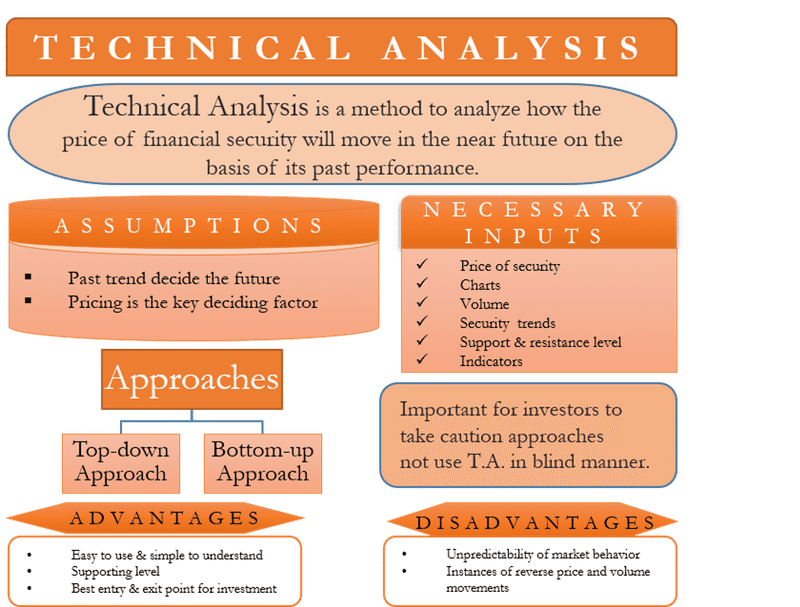
Technical Analysis – The Underlying Assumptions
The two main techniques for evaluating securities and choosing an investment strategy are fundamental analysis and technical analysis. While technical analysis assumes that a security's price already represents all publicly available information and instead concentrates on the statistical examination of price movements, the fundamental analysis examines a company's financial statements to establish the true worth of the business.
Instead of examining a security's intrinsic characteristics, technical analysis looks for patterns and trends in order to understand the market sentiment underlying price trends.
A number of editorials by Charles Dow on technical analysis theory have been published. Two fundamental presumptions from his publications have been the cornerstones of technical analysis trading ever since.
- However, even seemingly random market price movements appear to move in recognizable patterns and trends that tend to reoccur over time.
- Markets are efficient with values indicating elements that influence a security's price.
Dow's work is still used today in the realm of technical analysis. Professional analysts often subscribe to three underlying tenets of the field:
- Everything is discounted in the market: The fundamentals of a company, general market variables, and market psychology, according to technical experts, are all already factored into the stock price. The Efficient Markets Hypothesis (EMH), which draws a similar conclusion about pricing, is consistent with this point of view. The only thing left is to analyze price changes, which technical analysts believe to be the outcome of market supply and demand for a specific stock.
- Price trends and movements: Regardless of the time range being analyzed, technical analysts anticipate that prices will display tendencies even in seemingly random market movements. To put it another way, a stock price is more likely to stick with a previous pattern than to fluctuate unpredictably. On this premise, the majority of technical trading methods are built.
- Technical analysts hold the view that history has a tendency to repeat itself: Market psychology, which has a tendency to be quite predictable based on emotions like fear or excitement, is sometimes blamed for the repeated nature of price fluctuations. In order to examine these feelings and subsequent market movements and understand trends, technical analysis analyzes chart patterns. Although many technical analysis techniques have been around for more than a century, they are still regarded as useful because they show patterns in price movements that frequently recur.
Identifying the right way to approach Technical Analysis
The top-down technique and the bottom-up approach are the two main approaches used in technical analysis. Long-term investors frequently adopt a bottom-up strategy, while short-term traders frequently adopt a top-down strategy. In addition, there are five fundamental phases to beginning a technical analysis project.
Top-Down
The top-down method of macroeconomic analysis considers the entire economy before concentrating on specific securities. In the case of equities, a trader would initially concentrate on economies, then sectors, and last firms. This strategy places less emphasis on long-term valuations and more on short-term rewards for traders. For instance, a trader might be interested in equities as a buying opportunity if they broke out from their 50-day moving average.
Bottom-Up
The bottom-up method disregards the macroeconomic perspective in favor of individual stocks. It entails examining a stock that is interesting on a fundamental level for possible entry and exit points. For instance, a trader may locate a stock that is cheap in a downtrend and utilize technical analysis to pinpoint an exact entry point when the stock may be bottoming out. They aim for value in their choices and expect to view their trades in the long term.
In addition to these factors, certain traders may favor using particular methods of technical analysis. Swing or position traders may use chart patterns and technical indicators while day traders may employ straightforward trendlines and volume indicators. Trading firms creating automated algorithms may have wholly distinct specifications that influence trading decisions using a mix of volume indicators and technical indicators.
- Decide on a trading strategy or system
Finding a strategy or creating a trading system is the first step. For instance, a new trader might opt to use the moving average crossover technique, in which they monitor the movement of two moving averages (the 50-day and 200-day) on a certain stock price.
For this approach, an upward price trend is shown and a buy signal is generated when the short-term 50-day moving average crosses over the long-term 200-day moving average. A sell signal is an exact opposite.
- Determine securities
The aforementioned method is most suited for highly liquid and volatile equities rather than illiquid or steady stocks, however not all stocks or securities will fit with it. In this instance, different moving averages such as 15-day and 50-day moving averages may be needed depending on the stocks or contracts.
- Select the best brokerage
Choose a trading account that can accommodate the chosen security type (e.g., common stock, penny stock, futures, options, etc.). In order to maximize earnings, it should provide the necessary capability for tracking and monitoring the chosen technical indicators while keeping costs to a minimum. A simple account with moving averages on candlestick charts might work for the aforementioned method.
- Follow and examine trades
Depending on their plan, several levels of functionality may be needed by traders. To obtain Level II quotes and market maker visibility, for instance, day traders will need a margin account. But in the aforementioned scenario, a basic account might be the better choice due to its reduced cost.
- Employ extra software or tools
To achieve the best performance, more features might be required. Others may use automated trading systems to conduct deals on their behalf, while some traders may need smartphone notifications or access to trading while they are on the go.
Tips and Risk Factors
It's crucial to undertake further research in addition to the aforementioned considerations because trading might be difficult. Other important factors include:
- Being aware of the underlying logic and reasoning behind the technical analysis.
- Back-testing trading techniques to determine their historical performance.
- Using a trial account to practice trading before using real money.
- Understanding the limitations of technical analysis can help you avoid costly mistakes and unpleasant surprises.
- Considering scalability and potential needs in a smart and flexible manner.
- Attempting to assess a trading account's characteristics by obtaining a free trial.
- Beginning little at first and growing as you acquire experience.
The Pros and Cons
Advantages
- Provides information on volume trends: Supply & Demand control the trading market. You can learn a lot about traders' sentiments as a result. You can evaluate how the market is performing generally. Typically, high demand drives up prices while high supply drives them down.
- Explains when to enter and leave: Technical analysis can help you decide when to join or leave a game.
- Updated information is provided: Price reflects all of the information that is known about an asset. Prices may go up or down, but the equilibrium point for all information is ultimately the present price.
- Patterns give you direction: You can use patterns as a guide to lead your purchase and sell decisions since they provide you with direction.
Disadvantages
- The charts are ruined by too many indicators: Too many indicators can result in muddled signals that could impair your interpretation.
- Fundamentals not taken into account: Technical analysis does not take a company's fundamentals into account. In the case of extended time periods, it may prove dangerous.
In conclusion
Since technical analysis fills in information gaps, many investors use both fundamental and technical analysis while making investment decisions. Technical analysis can help traders and investors increase their long-term risk-adjusted returns, but it's crucial to comprehend and apply these strategies before using real money to avoid costly mistakes.
FAQ
What are the limitations of technical analysis?
The assumption behind technical analysis, according to its detractors, is incorrect because history does not always repeat itself. Critics claim that studying price patterns is pointless because history does not repeat itself.
How can you specialize in technical analysis?
Technical analysis can be learned in many different ways. Learning the fundamentals of investing, stocks, markets, and financials is the first step. All of this can be learned through books, classes, internet learning, and other resources. Once the fundamentals are grasped, you can move on to using the same resources, but ones that concentrate solely on technical analysis.
What are the methods of technical analysis?
Bar charts, candlestick charts, line charts, and point-and-figure charts are the primary tools used in technical analysis. Technical analysts utilize these chart patterns to identify trade signals.
What are the three types of analysis?
Technical, sentimental, and fundamental analysis are the three forms of analysis used in trading.
Is technical or fundamental analysis more profitable?
Technical analysis is more suited for short-term trading and market timing, whereas fundamental analysis is most effective for long-term investments. To plan and carry out investments over the medium and long term, both might be used together.
For predicting future price movements, technical analysis is more accurate than fundamental analysis, at least when applied to trends and momentum.


