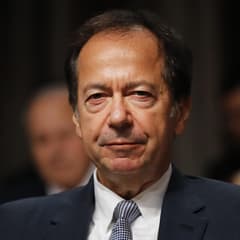
John Paulson Paulson & Co
John Paulson is the founder of Paulson & Co., a firm that became world-famous for profits related to the 2007–2008 housing and credit crisis. Beyond that landmark trade, the firm has pursued merger arbitrage, event-driven, and opportunistic credit and equity strategies. Paulson remains one of the most recognized names in modern hedge fund history.
Top Buys
| Rank | Stock | Value |
|---|---|---|
| 1 |
AGN
Allergan plc
AGN
|
+$1.16B |
| 2 |

AIG
AIG
|
+$783M |
| 3 |
CSC
Computer Sciences
CSC
|
+$274M |
| 4 |

Bausch Health
BHC
|
+$271M |
| 5 |

T-Mobile US
TMUS
|
+$265M |
Top Sells
| Rank | Stock | Value |
|---|---|---|
| 1 |
AGN
Allergan Inc
AGN
|
+$1.35B |
| 2 |
COV
Covidien
COV
|
+$1.03B |
| 3 |

Equinix
EQIX
|
+$409M |
| 4 |

Alibaba
BABA
|
+$198M |
| 5 |
PETM
PetSmart
PETM
|
+$163M |
Sector Composition
| Rank | Sector | Weight |
|---|---|---|
| 1 | Healthcare | 35.93% |
| 2 | Communication Services | 16.06% |
| 3 | Miscellaneous | 15.1% |
| 4 | Energy | 7.33% |
| 5 | Consumer Discretionary | 7% |
| Name | Market Value | Portfolio Weight | Shares or Principal |
Change in Stake | Capital Flow | Held Since | |
|---|---|---|---|---|---|---|---|
|
SHPG
1
DELISTED
Shire
SHPG
| $1.99B | 10.15% |
8,328,304
| – | – |
2013 Q2
7 quarters
|
|
|
AGN
2
DELISTED
Allergan plc
AGN
| $1.68B | 8.55% |
5,640,788
+4,080,187
| +261% | +$1.16B |
2014 Q1
4 quarters
|
|
|
TWC
3
DELISTED
Time Warner Cable
TWC
| $1.3B | 6.64% |
8,696,000
| – | – |
2013 Q3
6 quarters
|
|

4
SPDR Gold Trust
GLD
$122B
| $1.16B | 5.92% |
10,234,852
| – | – |
2013 Q2
7 quarters
|
|
|
MNK
5
DELISTED
Mallinckrodt
MNK
| $1.07B | 5.46% |
8,460,293
-552,000
| -6% | -$63.1M |
2013 Q3
6 quarters
|
|
|
DTV
6
DELISTED
DIRECTV
DTV
| $970M | 4.94% |
11,400,000
| – | – |
2014 Q2
3 quarters
|
|
|
SLXP
7
DELISTED
Salix Pharmaceuticals
SLXP
| $950M | 4.84% |
5,500,000
-306,000
| -5% | -$44.9M |
2014 Q4
1 quarter
|
|
|
STAY
8
DELISTED
Extended Stay America
STAY
| $931M | 4.74% |
47,661,591
| – | – |
2013 Q4
5 quarters
|
|

9
Viatris
VTRS
$22.8B
| $887M | 4.52% |
14,948,400
| – | – |
2013 Q2
7 quarters
|
|
|
10
AIG
AIG
$41.8B
| $800M | 4.07% |
+14,603,200
| New | +$783M |
2015 Q1
0 quarters
|
|
|
11
T-Mobile US
TMUS
$172B
| $756M | 3.85% |
23,844,900
+8,507,200
| +55% | +$265M |
2013 Q2
7 quarters
|
|
|
HMHC
12
DELISTED
Houghton Mifflin Harcourt
HMHC
| $726M | 3.7% |
30,912,558
| – | – |
2013 Q4
5 quarters
|
|

13
Grifois
GRFS
$5.58B
| $584M | 2.97% |
35,603,480
+19,200
| +0.1% | +$321K |
2013 Q2
7 quarters
|
|
|
TLM
14
DELISTED
Talisman Energy
TLM
| $537M | 2.73% |
70,000,000
| – | – |
2014 Q4
1 quarter
|
|
|
15
Bausch Health
BHC
$3.2B
| $407M | 2.07% |
2,050,000
+1,529,300
| +294% | +$271M |
2014 Q1
4 quarters
|
|
|
CIE
16
DELISTED
Cobalt International Energy
CIE
| $393M | 2% |
2,783,407
| – | – |
2013 Q2
7 quarters
|
|
|
WLL
17
DELISTED
Whiting Petroleum
WLL
| $385M | 1.96% |
41,495
-3,343
| -7% | -$33.9M |
2013 Q3
6 quarters
|
|

18
HCA Healthcare
HCA
$96.2B
| $354M | 1.8% |
4,711,900
| – | – |
2013 Q2
7 quarters
|
|

19
DELISTED
Anywhere Real Estate
HOUS
| $325M | 1.65% |
7,141,800
-2,083,200
| -23% | -$95.9M |
2013 Q2
7 quarters
|
|
|
CSC
20
DELISTED
Computer Sciences
CSC
| $273M | 1.39% |
+9,919,140
| New | +$274M |
2015 Q1
0 quarters
|
|

21
AngloGold Ashanti
AU
$38.9B
| $245M | 1.25% |
26,205,400
| – | – |
2013 Q2
7 quarters
|
|

22
Popular Inc
BPOP
$9.28B
| $163M | 0.83% |
4,739,600
-2,820,400
| -37% | -$93.3M |
2013 Q2
7 quarters
|
|
|
CVC
23
DELISTED
Cablevision Systems NY Group
CVC
| $154M | 0.78% |
8,400,000
-5,306,441
| -39% | -$102M |
2013 Q2
7 quarters
|
|

24
Radian Group
RDN
$4.61B
| $151M | 0.77% |
8,993,000
-2,050,000
| -19% | -$33.4M |
2013 Q2
7 quarters
|
|

25
DELISTED
Caesars Entertainment
CZR
| $143M | 0.73% |
13,608,300
| – | – |
2013 Q2
7 quarters
|
|
Similar funds








John Paulson's Q1 2015 Portfolio in Review
As of Q1 2015, John Paulson held 71 positions worth $19.6B, up 1.4% from $19.4B the previous quarter. Its ten largest holdings account for 60% of the portfolio.
John Paulson withdrew a net $734M in Q1 2015, closing 10 positions and reducing 18 holdings. Its most notable exit was Allergan Inc, an estimated $1.35B position sold in full.
By sector, the portfolio is most concentrated in Healthcare at 36% of assets, down from 38% a quarter earlier, followed by Communication Services and Miscellaneous.
Against the trend, John Paulson opened a new position in AIG worth $800M.
- John Paulson's largest Q1 2015 buy was AIG: 14,603,200 shares worth $800M.
- John Paulson added most to Allergan plc in Q1 2015, an estimated $1.16B increase.
- John Paulson's biggest Q1 2015 reduction was Sprint, cutting an estimated $117M.
- John Paulson fully exited Allergan Inc in Q1 2015, selling an estimated $1.35B.
- John Paulson's ten largest holdings make up 60% of its $19.6B portfolio in Q1 2015.
- John Paulson opened 8 new positions and closed 10 in Q1 2015.
- John Paulson's portfolio value rose 1.4% quarter-over-quarter to $19.6B.
Based on Paulson & Co's 13F filing for Q1 2015, filed 15 May 2015.