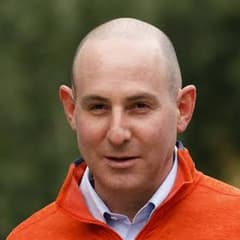
Eric Mandelblatt Soroban Capital Partners
Eric Mandelblatt is the founder of Soroban Capital Partners, a fundamental long/short equity firm. Soroban is known for research-intensive positions and a flexible approach across sectors. Mandelblatt’s public portfolio is followed among large fundamental hedge fund managers.
Top Buys
| Rank | Stock | Value |
|---|---|---|
| 1 |

CSX Corp
CSX
|
+$156M |
| 2 |

Mastercard
MA
|
+$129M |
| 3 |

Canadian Natural Resources
CNQ
|
+$65.5M |
| 4 |

Cenovus Energy
CVE
|
+$28.8M |
| 5 |

The Mosaic Company
MOS
|
+$7.54M |
Top Sells
| Rank | Stock | Value |
|---|---|---|
| 1 |

Visa
V
|
+$337M |
| 2 |

Microsoft
MSFT
|
+$273M |
| 3 |

Alcoa
AA
|
+$235M |
| 4 |

S&P Global
SPGI
|
+$211M |
| 5 |

Nutrien
NTR
|
+$143M |
Sector Composition
| Rank | Sector | Weight |
|---|---|---|
| 1 | Industrials | 27.3% |
| 2 | Materials | 15.5% |
| 3 | Technology | 15.21% |
| 4 | Energy | 14.59% |
| 5 | Consumer Discretionary | 13.82% |
| Name | Market Value | Portfolio Weight | Shares or Principal |
Change in Stake | Capital Flow | Held Since | |
|---|---|---|---|---|---|---|---|
|
1
CSX Corp
CSX
$96.7B
| $1.54B | 16.62% |
57,630,864
+5,030,569
| +10% | +$156M |
2019 Q4
11 quarters
|
|
|
2
Microsoft
MSFT
$3.88T
| $1.12B | 12.15% |
4,818,934
-1,035,711
| -18% | -$273M |
2020 Q1
10 quarters
|
|

3
Union Pacific
UNP
$181B
| $907M | 9.82% |
4,654,919
-333,381
| -7% | -$73.8M |
2016 Q2
25 quarters
|
|
|
4
Cenovus Energy
CVE
$52.2B
| $799M | 8.65% |
51,957,862
+1,619,040
| +3% | +$28.8M |
2021 Q4
3 quarters
|
|

5
Lowe's Companies
LOW
$128B
| $603M | 6.52% |
3,208,883
-698,780
| -18% | -$136M |
2020 Q4
7 quarters
|
|

6
Amazon
AMZN
$2.9T
| $446M | 4.83% |
3,948,200
| – | – |
2020 Q1
10 quarters
|
|

7
Alphabet (Google) Class C
GOOG
$3.65T
| $369M | 4% |
3,838,980
-442,600
| -10% | -$49.4M |
2017 Q2
21 quarters
|
|

8
Teck Resources
TECK
$30.1B
| $367M | 3.97% |
12,058,632
-1,553,835
| -11% | -$48M |
2021 Q4
3 quarters
|
|
|
9
Visa
V
$787B
| $348M | 3.77% |
1,960,650
-1,658,500
| -46% | -$337M |
2021 Q1
6 quarters
|
|
|
10
The Mosaic Company
MOS
$6.91B
| $332M | 3.6% |
6,873,501
+145,993
| +2% | +$7.54M |
2021 Q4
3 quarters
|
|

11
Analog Devices
ADI
$198B
| $283M | 3.06% |
2,031,223
-474,956
| -19% | -$75.1M |
2020 Q3
8 quarters
|
|

12
EQT Corp
EQT
$32.9B
| $264M | 2.85% |
6,469,016
| – | – |
2021 Q4
3 quarters
|
|

13
CF Industries
CF
$18.2B
| $239M | 2.59% |
2,487,821
| – | – |
2021 Q4
3 quarters
|
|

14
Yum! Brands
YUM
$42.8B
| $227M | 2.46% |
2,138,859
| – | – |
2022 Q1
2 quarters
|
|

15
DELISTED
US Steel
X
| $199M | 2.16% |
11,000,000
-683,862
| -6% | -$14.6M |
2021 Q4
3 quarters
|
|

16
Westlake Corp
WLK
$8.05B
| $176M | 1.9% |
2,021,674
+21,674
| +1% | +$2.08M |
2021 Q4
3 quarters
|
|

17
Alphabet (Google) Class A
GOOGL
$3.69T
| $172M | 1.87% |
1,801,339
-152,681
| -8% | -$16.9M |
2019 Q1
14 quarters
|
|
|
18
Canadian Natural Resources
CNQ
$100B
| $148M | 1.6% |
6,339,638
+2,530,681
| +66% | +$65.5M |
2021 Q4
3 quarters
|
|

19
Suncor Energy
SU
$80B
| $138M | 1.49% |
4,899,554
-3,241,594
| -40% | -$102M |
2021 Q4
3 quarters
|
|
|
20
Mastercard
MA
$570B
| $111M | 1.2% |
+390,257
| New | +$129M |
2022 Q3
0 quarters
|
|
|
21
Nutrien
NTR
$33.8B
| $91.1M | 0.99% |
1,092,051
-1,663,154
| -60% | -$143M |
2021 Q4
3 quarters
|
|

22
Wabtec
WAB
$50.6B
| $79.3M | 0.86% |
975,361
-453,888
| -32% | -$40.1M |
2022 Q2
1 quarter
|
|

23
Vale
VALE
$48.1B
| $27.5M | 0.3% |
2,062,324
-8,426,064
| -80% | -$111M |
2021 Q4
3 quarters
|
|
|
KAHC
24
DELISTED
KKR Acquisition Holdings I Corp.
KAHC
| $24.6M | 0.27% |
2,500,000
| – | – |
2021 Q2
5 quarters
|
|
|
LGV
25
DELISTED
Longview Acquisition Corp. II
LGV
| $24.6M | 0.27% |
2,500,000
| – | – |
2021 Q2
5 quarters
|
|
Similar funds








Eric Mandelblatt's Q3 2022 Portfolio in Review
As of Q3 2022, Eric Mandelblatt held 45 positions worth $9.24B, down 20% from $11.6B the previous quarter. Its ten largest holdings account for 74% of the portfolio.
Eric Mandelblatt withdrew a net $1.56B in Q3 2022, closing 5 positions and reducing 13 holdings. Its most notable exit was Alcoa, an estimated $235M position sold in full.
By sector, the portfolio is most concentrated in Industrials at 27% of assets, up from 24% a quarter earlier, followed by Materials and Technology.
Against the trend, Eric Mandelblatt opened a new position in Mastercard worth $111M.
- Eric Mandelblatt's largest Q3 2022 buy was Mastercard: 390,257 shares worth $111M.
- Eric Mandelblatt added most to CSX Corp in Q3 2022, an estimated $156M increase.
- Eric Mandelblatt's biggest Q3 2022 reduction was Visa, cutting an estimated $337M.
- Eric Mandelblatt fully exited Alcoa in Q3 2022, selling an estimated $235M.
- Eric Mandelblatt's ten largest holdings make up 74% of its $9.24B portfolio in Q3 2022.
- Eric Mandelblatt opened 1 new position and closed 5 in Q3 2022.
- Eric Mandelblatt's portfolio value fell 20% quarter-over-quarter to $9.24B.
Based on Soroban Capital Partners's 13F filing for Q3 2022, filed 14 Nov 2022.