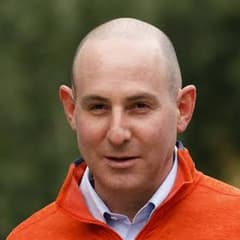
Eric Mandelblatt Soroban Capital Partners
Eric Mandelblatt is the founder of Soroban Capital Partners, a fundamental long/short equity firm. Soroban is known for research-intensive positions and a flexible approach across sectors. Mandelblatt’s public portfolio is followed among large fundamental hedge fund managers.
Top Buys
| Rank | Stock | Value |
|---|---|---|
| 1 |
RTN
Raytheon Company
RTN
|
+$509M |
| 2 |

Norfolk Southern
NSC
|
+$258M |
| 3 |

Union Pacific
UNP
|
+$138M |
| 4 |

WIX.com
WIX
|
+$100M |
| 5 |

Alibaba
BABA
|
+$73.1M |
Top Sells
| Rank | Stock | Value |
|---|---|---|
| 1 |

Sony
SONY
|
+$215M |
| 2 |

RTX Corp
RTX
|
+$207M |
| 3 |

Lam Research
LRCX
|
+$125M |
| 4 |

Applied Materials
AMAT
|
+$112M |
| 5 |

Alphabet (Google) Class A
GOOGL
|
+$106M |
Sector Composition
| Rank | Sector | Weight |
|---|---|---|
| 1 | Industrials | 37.66% |
| 2 | Consumer Discretionary | 25.06% |
| 3 | Communication Services | 17.43% |
| 4 | Technology | 12.86% |
| 5 | Miscellaneous | 5.45% |
| Name | Market Value | Portfolio Weight | Shares or Principal |
Change in Stake | Capital Flow | Held Since | |
|---|---|---|---|---|---|---|---|
|
RTN
1
DELISTED
Raytheon Company
RTN
| $855M | 12.03% |
4,358,650
+2,746,144
| +170% | +$509M |
2019 Q2
1 quarter
|
|
|
2
Union Pacific
UNP
$181B
| $832M | 11.71% |
5,138,356
+818,289
| +19% | +$138M |
2016 Q2
13 quarters
|
|
|
3
Alibaba
BABA
$236B
| $641M | 9.03% |
3,835,544
+425,084
| +12% | +$73.1M |
2018 Q3
4 quarters
|
|

4
Marriott International
MAR
$109B
| $603M | 8.48% |
4,846,132
| – | – |
2018 Q4
3 quarters
|
|

5
Optimum Communications Inc
OPTU
$240M
| $602M | 8.48% |
21,000,000
| – | – |
2019 Q1
2 quarters
|
|

6
NXP Semiconductors
NXPI
$67.1B
| $552M | 7.76% |
5,055,285
-945,461
| -16% | -$96.6M |
2015 Q2
17 quarters
|
|
|
7
RTX Corp
RTX
$270B
| $514M | 7.23% |
5,977,878
-2,491,869
| -29% | -$207M |
2018 Q2
5 quarters
|
|
|
8
Norfolk Southern
NSC
$74.8B
| $475M | 6.69% |
2,645,126
+1,402,276
| +113% | +$258M |
2018 Q1
6 quarters
|
|
|
9
Alphabet (Google) Class A
GOOGL
$3.68T
| $333M | 4.69% |
5,461,000
-1,794,320
| -25% | -$106M |
2019 Q1
2 quarters
|
|

10
Alphabet (Google) Class C
GOOG
$3.64T
| $303M | 4.27% |
4,973,400
| – | – |
2017 Q2
9 quarters
|
|

11
Hilton Worldwide Holdings Inc. Common Stock
HLT
$82.9B
| $287M | 4.03% |
3,079,137
| – | – |
2018 Q4
3 quarters
|
|

12
DELISTED
Qorvo
QRVO
| $208M | 2.92% |
2,799,910
-152,714
| -5% | -$11.1M |
2018 Q3
4 quarters
|
|
|
GRA
13
DELISTED
W.R. Grace & Co.
GRA
| $186M | 2.62% |
2,790,996
| – | – |
2018 Q2
5 quarters
|
|
|
14
WIX.com
WIX
$2.77B
| $150M | 2.1% |
1,280,999
+718,560
| +128% | +$100M |
2019 Q2
1 quarter
|
|

15
CALL
LyondellBasell Industries
LYB
$20.7B
| $134M | 1.89% |
1,500,000
| – | – |
2019 Q2
1 quarter
|
|
|
16
CALL
Marriott International
MAR
$109B
| $124M | 1.75% |
1,000,000
| – | – |
2019 Q1
2 quarters
|
|
|
RTN
17
CALL
DELISTED
Raytheon Company
RTN
| $98.1M | 1.38% |
500,000
| – | – |
2019 Q2
1 quarter
|
|

18
Linde
LIN
$241B
| $68.6M | 0.96% |
+353,880
| New | +$68.6M |
2019 Q3
0 quarters
|
|

19
Domino's
DPZ
$10.9B
| $63.5M | 0.89% |
+259,613
| New | +$64.3M |
2019 Q3
0 quarters
|
|

20
Axalta
AXTA
$7.84B
| $40.5M | 0.57% |
1,343,135
+223,314
| +20% | +$6.59M |
2018 Q1
6 quarters
|
|
|
21
CALL
Alphabet (Google) Class A
GOOGL
$3.68T
| $30.5M | 0.43% |
500,000
| – | – |
2019 Q2
1 quarter
|
|

22
SAP
SAP
$270B
| $4.13M | 0.06% |
+35,027
| New | +$4.34M |
2019 Q3
0 quarters
|
|
|
23
Sony
SONY
$156B
| $1.14M | 0.02% |
96,535
-19,062,940
| -99% | -$215M |
2018 Q3
4 quarters
|
|
|
24
Applied Materials
AMAT
$299B
| – | – |
-2,503,762
| Closed | -$112M | – |
|
|
25
Lam Research
LRCX
$291B
| – | – |
-6,657,590
| Closed | -$125M | – |
|
Similar funds








Eric Mandelblatt's Q3 2019 Portfolio in Review
As of Q3 2019, Eric Mandelblatt held 26 positions worth $7.11B, up 6.7% from $6.66B the previous quarter. Its ten largest holdings account for 80% of the portfolio.
Eric Mandelblatt deployed $300M of net new capital in Q3 2019, opening 3 new positions and adding to 6 existing holdings. Its largest new stake was Linde: 353,880 shares worth $68.6M.
By sector, the portfolio is most concentrated in Industrials at 38% of assets, up from 29% a quarter earlier, followed by Consumer Discretionary and Communication Services.
On the sell side, the largest reduction was Sony, an estimated $215M trimmed.
- Eric Mandelblatt's largest Q3 2019 buy was Linde: 353,880 shares worth $68.6M.
- Eric Mandelblatt added most to Raytheon Company in Q3 2019, an estimated $509M increase.
- Eric Mandelblatt's biggest Q3 2019 reduction was Sony, cutting an estimated $215M.
- Eric Mandelblatt fully exited Lam Research in Q3 2019, selling an estimated $125M.
- Eric Mandelblatt's ten largest holdings make up 80% of its $7.11B portfolio in Q3 2019.
- Eric Mandelblatt opened 3 new positions and closed 3 in Q3 2019.
- Eric Mandelblatt's portfolio value rose 6.7% quarter-over-quarter to $7.11B.
Based on Soroban Capital Partners's 13F filing for Q3 2019, filed 14 Nov 2019.