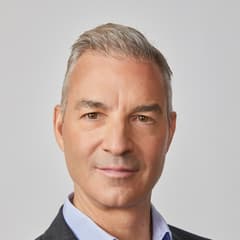
Daniel Loeb Third Point
Daniel Loeb is the founder of Third Point, an event-driven and activist-oriented hedge fund. He is known for pointed letters to management teams, catalyst-driven investing, and a flexible mandate across equities and credit. Loeb’s campaigns and portfolio shifts regularly generate attention beyond specialist hedge fund circles.
Top Buys
| Rank | Stock | Value |
|---|---|---|
| 1 |

Meta Platforms (Facebook)
META
|
+$331M |
| 2 |

Microsoft
MSFT
|
+$233M |
| 3 |

T-Mobile US
TMUS
|
+$139M |
| 4 |

US Steel
X
|
+$133M |
| 5 |

Regal Rexnord
RRX
|
+$100M |
Top Sells
| Rank | Stock | Value |
|---|---|---|
| 1 |

Alibaba
BABA
|
+$246M |
| 2 |

NVIDIA
NVDA
|
+$212M |
| 3 |

HCA Healthcare
HCA
|
+$182M |
| 4 |
DEN
Denbury Inc.
DEN
|
+$144M |
| 5 |
ATVI
Activision Blizzard
ATVI
|
+$139M |
Sector Composition
| Rank | Sector | Weight |
|---|---|---|
| 1 | Technology | 16.95% |
| 2 | Consumer Discretionary | 16.16% |
| 3 | Utilities | 15.72% |
| 4 | Healthcare | 11.89% |
| 5 | Industrials | 11.21% |
| Name | Market Value | Portfolio Weight | Shares or Principal |
Change in Stake | Capital Flow | Held Since | |
|---|---|---|---|---|---|---|---|

1
PG&E
PCG
$38.9B
| $917M | 13.91% |
56,860,000
+2,860,000
| +5% | +$49.2M |
2020 Q3
12 quarters
|
|
|
2
Microsoft
MSFT
$3.9T
| $703M | 10.66% |
2,225,000
+705,000
| +46% | +$233M |
2022 Q4
3 quarters
|
|

3
Danaher
DHR
$162B
| $608M | 9.22% |
2,763,600
-169,200
| -6% | -$37.7M |
2015 Q3
32 quarters
|
|

4
Amazon
AMZN
$2.72T
| $595M | 9.02% |
4,680,000
+580,000
| +14% | +$77.7M |
2023 Q2
1 quarter
|
|

5
Bath & Body Works
BBWI
$4.26B
| $468M | 7.1% |
13,850,000
| – | – |
2022 Q3
4 quarters
|
|
|
6
Meta Platforms (Facebook)
META
$1.65T
| $330M | 5.01% |
+1,100,000
| New | +$331M |
2023 Q3
0 quarters
|
|

7
DuPont de Nemours
DD
$18.1B
| $310M | 4.69% |
3,306,167
-358,500
| -10% | -$33.7M |
2021 Q1
10 quarters
|
|

8
Intercontinental Exchange
ICE
$91.7B
| $263M | 3.99% |
2,389,934
+539,934
| +29% | +$61.9M |
2023 Q2
1 quarter
|
|

9
Jacobs Solutions
J
$16.9B
| $246M | 3.73% |
2,176,146
+538,013
| +33% | +$58M |
2023 Q1
2 quarters
|
|

10
Ferguson
FERG
$44B
| $209M | 3.17% |
1,275,000
| – | – |
2022 Q3
4 quarters
|
|

11
Uber
UBER
$139B
| $193M | 2.93% |
4,200,000
+1,425,000
| +51% | +$65.1M |
2023 Q2
1 quarter
|
|

12
American International
AIG
$43.3B
| $179M | 2.71% |
2,950,000
| – | – |
2022 Q4
3 quarters
|
|

13
Option Care Health
OPCH
$4.7B
| $176M | 2.67% |
5,450,659
+1,950,659
| +56% | +$65.8M |
2023 Q2
1 quarter
|
|

14
International Flavors & Fragrances
IFF
$23.8B
| $169M | 2.56% |
2,475,000
-175,000
| -7% | -$12.8M |
2022 Q4
3 quarters
|
|
|
15
DELISTED
US Steel
X
| $154M | 2.34% |
+4,750,000
| New | +$133M |
2023 Q3
0 quarters
|
|

16
TSMC
TSM
$2.14T
| $154M | 2.34% |
1,775,000
-675,000
| -28% | -$63.8M |
2023 Q2
1 quarter
|
|
|
17
T-Mobile US
TMUS
$170B
| $140M | 2.12% |
+1,000,000
| New | +$139M |
2023 Q3
0 quarters
|
|

18
Vistra
VST
$47.3B
| $120M | 1.81% |
3,604,252
+285,652
| +9% | +$8.58M |
2023 Q1
2 quarters
|
|

19
Alphabet (Google) Class A
GOOGL
$4T
| $118M | 1.79% |
900,000
-525,000
| -37% | -$67.9M |
2023 Q1
2 quarters
|
|
|
20
Regal Rexnord
RRX
$10B
| $92.9M | 1.41% |
+650,000
| New | +$100M |
2023 Q3
0 quarters
|
|

21
Hertz
HTZ
$759M
| $91.8M | 1.39% |
7,494,821
+175,094
| +2% | +$2.93M |
2021 Q4
7 quarters
|
|

22
WESCO International
WCC
$15.8B
| $89.9M | 1.36% |
625,000
| – | – |
2023 Q1
2 quarters
|
|

23
DELISTED
Global Blue Group Holding
GB
| $51M | 0.77% |
8,387,601
-100,000
| -1% | -$531K |
2018 Q2
21 quarters
|
|

24
DELISTED
Apollo Global Management Series A
APO.PRA
| $49.6M | 0.75% |
+900,000
| New | +$48.5M |
2023 Q3
0 quarters
|
|

25
Telephone and Data Systems
TDS
$3.97B
| $39.1M | 0.59% |
+2,136,832
| New | +$30.8M |
2023 Q3
0 quarters
|
|
Similar funds






Daniel Loeb's Q3 2023 Portfolio in Review
As of Q3 2023, Daniel Loeb held 55 positions worth $6.59B, down 3.4% from $6.82B the previous quarter. Its ten largest holdings account for 70% of the portfolio.
Daniel Loeb's Q3 2023 filing shows 10 new, 10 increased, 6 reduced and 13 closed positions. Its largest new stake was Meta Platforms (Facebook): 1,100,000 shares worth $330M. The largest sale was Alibaba, an estimated $246M.
By sector, the portfolio is most concentrated in Technology at 17% of assets, down from 23% a quarter earlier, followed by Consumer Discretionary and Utilities.
- Daniel Loeb's largest Q3 2023 buy was Meta Platforms (Facebook): 1,100,000 shares worth $330M.
- Daniel Loeb added most to Microsoft in Q3 2023, an estimated $233M increase.
- Daniel Loeb's biggest Q3 2023 reduction was Alphabet (Google) Class A, cutting an estimated $67.9M.
- Daniel Loeb fully exited Alibaba in Q3 2023, selling an estimated $246M.
- Daniel Loeb's ten largest holdings make up 70% of its $6.59B portfolio in Q3 2023.
- Daniel Loeb opened 10 new positions and closed 13 in Q3 2023.
- Daniel Loeb's portfolio value fell 3.4% quarter-over-quarter to $6.59B.
Based on Third Point's 13F filing for Q3 2023, filed 14 Nov 2023.