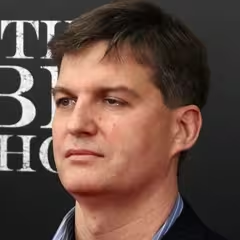
Michael Burry Scion Asset Management
Michael Burry is most famous for predicting the 2008 subprime mortgage crisis and profiting from it by taking a short position against mortgage-backed securities. He founded the hedge fund Scion Capital in 2000, which he ran until 2008, generating impressive returns for investors. Burry’s investment style centers on deep fundamental analysis, focusing on undervalued or overvalued companies and assets.
Top Buys
| Rank | Stock | Value |
|---|---|---|
| 1 |

Nexstar Media Group
NXST
|
+$5.46M |
| 2 |

Alibaba
BABA
|
+$4.58M |
| 3 |

Booking.com
BKNG
|
+$4.54M |
| 4 |

JD.com
JD
|
+$4.35M |
| 5 |

CMB.TECH NV
CMBT
|
+$3.25M |
Top Sells
| Rank | Stock | Value |
|---|---|---|
| 1 |

Expedia Group
EXPE
|
+$10.9M |
| 2 |

Charter Communications
CHTR
|
+$9.18M |
| 3 |

Generac Holdings
GNRC
|
+$8.2M |
| 4 |

Cigna
CI
|
+$7.72M |
| 5 |

CVS Health
CVS
|
+$6.91M |
Sector Composition
| Rank | Sector | Weight |
|---|---|---|
| 1 | Miscellaneous | 55.64% |
| 2 | Consumer Discretionary | 22.06% |
| 3 | Communication Services | 7.05% |
| 4 | Energy | 6.7% |
| 5 | Industrials | 5.85% |
| Name | Market Value | Portfolio Weight | Shares or Principal |
Change in Stake | Capital Flow | Held Since | |
|---|---|---|---|---|---|---|---|

1
PUT
iShares Semiconductor ETF
SOXX
$42.8B
| $47.4M | 47.86% |
+900,000
| New | +$50M |
2023 Q3
0 quarters
|
|
|
2
PUT
Booking.com
BKNG
$119B
| $7.71M | 7.79% |
+62,500
| New | +$7.57M |
2023 Q3
0 quarters
|
|

3
Stellantis
STLA
$11.1B
| $7.65M | 7.73% |
400,000
+75,000
| +23% | +$1.4M |
2023 Q2
1 quarter
|
|
|
4
Nexstar Media Group
NXST
$6.41B
| $6.98M | 7.05% |
48,651
+33,651
| +224% | +$5.46M |
2023 Q2
1 quarter
|
|

5
Star Bulk Carriers
SBLK
$3.25B
| $4.82M | 4.87% |
250,000
+65,260
| +35% | +$1.16M |
2023 Q2
1 quarter
|
|
|
6
Booking.com
BKNG
$119B
| $4.63M | 4.67% |
+37,500
| New | +$4.54M |
2023 Q3
0 quarters
|
|
|
7
Alibaba
BABA
$235B
| $4.34M | 4.38% |
+50,000
| New | +$4.58M |
2023 Q3
0 quarters
|
|
|
8
CMB.TECH NV
CMBT
$5.08B
| $4.11M | 4.15% |
250,000
+197,100
| +373% | +$3.25M |
2023 Q2
1 quarter
|
|
|
9
JD.com
JD
$37.7B
| $3.64M | 3.68% |
+125,000
| New | +$4.35M |
2023 Q3
0 quarters
|
|

10
Hudson Pacific Properties
HPP
$481M
| $2.66M | 2.69% |
57,143
+21,429
| +60% | +$920K |
2023 Q2
1 quarter
|
|

11
Crescent Energy
CRGY
$5.12B
| $2.53M | 2.55% |
200,000
-43,963
| -18% | -$538K |
2023 Q2
1 quarter
|
|

12
The RealReal
REAL
$1.81B
| $1.58M | 1.6% |
750,000
-750,000
| -50% | -$1.83M |
2023 Q1
2 quarters
|
|

13
Safe Bulkers
SB
$944M
| $972K | 0.98% |
300,000
+172,475
| +135% | +$557K |
2023 Q2
1 quarter
|
|
|
14
Charter Communications
CHTR
$15.8B
| – | – |
-25,000
| Closed | -$9.18M | – |
|
|
15
Cigna
CI
$78.3B
| – | – |
-27,500
| Closed | -$7.72M | – |
|

16
Costamare
CMRE
$1.62B
| – | – |
-125,000
| Closed | -$1.21M | – |
|

17
Comstock Resources
CRK
$4.46B
| – | – |
-200,000
| Closed | -$2.32M | – |
|
|
18
CVS Health
CVS
$114B
| – | – |
-100,000
| Closed | -$6.91M | – |
|

19
iShares MSCI Japan ETF
EWJ
$23.3B
| – | – |
-10,000
| Closed | -$619K | – |
|

20
iShares MSCI Japan Value ETF
EWJV
$777M
| – | – |
-13,600
| Closed | -$372K | – |
|
|
21
Expedia Group
EXPE
$30.6B
| – | – |
-100,000
| Closed | -$10.9M | – |
|

22
Franklin FTSE Japan ETF
FLJP
$4.19B
| – | – |
-30,000
| Closed | -$812K | – |
|

23
The GEO Group
GEO
$4.28B
| – | – |
-600,000
| Closed | -$4.3M | – |
|
|
24
Generac Holdings
GNRC
$11.3B
| – | – |
-55,000
| Closed | -$8.2M | – |
|

25
DELISTED
Hanesbrands
HBI
| – | – |
-400,000
| Closed | -$1.82M | – |
|
Similar funds








Michael Burry's Q3 2023 Portfolio in Review
As of Q3 2023, Michael Burry held 38 positions worth $99M, down 94% from $1.74B the previous quarter. Its ten largest holdings account for 95% of the portfolio.
Michael Burry withdrew a net $67.9M in Q3 2023, closing 25 positions and reducing 2 holdings. Its most notable exit was Expedia Group, an estimated $10.9M position sold in full.
By sector, the portfolio is most concentrated in Miscellaneous at 56% of assets, down from 94% a quarter earlier, followed by Consumer Discretionary and Communication Services.
Against the trend, Michael Burry opened a new position in Alibaba worth $4.34M.
- Michael Burry's largest Q3 2023 buy was Alibaba: 50,000 shares worth $4.34M.
- Michael Burry added most to Nexstar Media Group in Q3 2023, an estimated $5.46M increase.
- Michael Burry's biggest Q3 2023 reduction was The RealReal, cutting an estimated $1.83M.
- Michael Burry fully exited Expedia Group in Q3 2023, selling an estimated $10.9M.
- Michael Burry's ten largest holdings make up 95% of its $99M portfolio in Q3 2023.
- Michael Burry opened 5 new positions and closed 25 in Q3 2023.
- Michael Burry's portfolio value fell 94% quarter-over-quarter to $99M.
Based on Scion Asset Management's 13F filing for Q3 2023, filed 14 Nov 2023.