We are live on !
Find out more
KTC
Kentucky Trust Company Portfolio holdings
AUM
$200M
Turnover
2.5%
1-Year Est. Return
22.53%
This Fund
S&P 500
This Quarter Est. Return
-0.06%
1 Year Est. Return
+22.53%
3 Year Est. Return
–
5 Year Est. Return
–
10 Year Est. Return
–
AUM
$200M
AUM Growth
-$7.77M
(-3.7%)
Cap. Flow
-$3.25M
Cap. Flow % of AUM
Cap. Flow %
-1.62%
Top 10 Holdings %
Top 10 Hldgs %
33.11%
Holding
320
New
4
Increased
53
Reduced
70
Closed
4
Avg Time Held
1.5
years
Top 10 Avg Time Held
1.3
years
Top 20 Avg Time Held
1.5
years
Top Buys
| Rank | Stock | Value |
|---|---|---|
| 1 |

BlackRock US Equity Factor Rotation ETF
DYNF
|
+$298K |
| 2 |

iShares Preferred and Income Securities ETF
PFF
|
+$112K |
| 3 |

Verizon
VZ
|
+$77.2K |
| 4 |

SpaceX
SPCX
|
+$67.8K |
| 5 |

Amphenol
APH
|
+$53.6K |
Top Sells
| Rank | Stock | Value |
|---|---|---|
| 1 |

Alphabet (Google) Class C
GOOG
|
+$472K |
| 2 |

Microsoft
MSFT
|
+$466K |
| 3 |

Apple
AAPL
|
+$256K |
| 4 |

Emerson Electric
EMR
|
+$252K |
| 5 |

Johnson & Johnson
JNJ
|
+$227K |
Sector Composition
| Rank | Sector | Weight |
|---|---|---|
| 1 | Technology | 19.21% |
| 2 | Financials | 16.45% |
| 3 | Miscellaneous | 12.47% |
| 4 | Industrials | 9.83% |
| 5 | Healthcare | 9.83% |
| Name | Market Value | Portfolio Weight | Shares or Principal |
Change in Stake | Capital Flow | Held Since | |
|---|---|---|---|---|---|---|---|
|
1
Apple
AAPL
$4.98T
| $9.8M | 4.92% |
29,577
-798
| -3% | -$256K |
2024 Q4
7 quarters
|
|

2
US Bancorp
USB
$92.6B
| $9.18M | 4.59% |
158,996
+190
| +0.1% | +$11.9K |
2024 Q4
7 quarters
|
|
|
3
Microsoft
MSFT
$3.94T
| $8.85M | 4.42% |
17,249
-1,008
| -6% | -$466K |
2024 Q4
7 quarters
|
|

4
JPMorgan Chase
JPM
$888B
| $7.4M | 3.7% |
22,375
-349
| -2% | -$122K |
2024 Q4
7 quarters
|
|

5
DNP Select Income Fund
DNP
$3.85B
| $6.58M | 3.29% |
687,492
+3,701
| +0.5% | +$39.6K |
2024 Q4
7 quarters
|
|
|
6
iShares Preferred and Income Securities ETF
PFF
$11.6B
| $5.77M | 2.88% |
195,477
+3,683
| +2% | +$112K |
2024 Q4
7 quarters
|
|
|
7
Johnson & Johnson
JNJ
$665B
| $5.28M | 2.64% |
19,927
-862
| -4% | -$227K |
2024 Q4
7 quarters
|
|
|
8
Alphabet (Google) Class C
GOOG
$3.49T
| $4.76M | 2.38% |
13,974
-1,370
| -9% | -$472K |
2024 Q4
7 quarters
|
|

9
Caterpillar
CAT
$256B
| $4.56M | 2.28% |
5,620
-114
| -2% | -$96.7K |
2024 Q4
7 quarters
|
|

10
Applied Materials
AMAT
$264B
| $4.04M | 2.02% |
7,895
+15
| +0.2% | +$7.62K |
2024 Q4
7 quarters
|
|

11
Southern Company
SO
$106B
| $3.98M | 1.99% |
47,961
-655
| -1% | -$59.7K |
2024 Q4
7 quarters
|
|

12
Procter & Gamble
PG
$383B
| $3.91M | 1.95% |
26,882
-175
| -0.6% | -$25.6K |
2024 Q4
7 quarters
|
|

13
Amazon
AMZN
$2.8T
| $3.87M | 1.93% |
15,528
-79
| -0.5% | -$20.1K |
2024 Q4
7 quarters
|
|

14
PNC Financial Services
PNC
$89.5B
| $3.82M | 1.91% |
17,177
-10
| -0.1% | -$2.45K |
2024 Q4
7 quarters
|
|

15
Chevron
CVX
$415B
| $3.71M | 1.85% |
18,157
-534
| -3% | -$105K |
2024 Q4
7 quarters
|
|

16
NVIDIA
NVDA
$4.51T
| $3.67M | 1.83% |
16,066
-1,015
| -6% | -$218K |
2024 Q4
7 quarters
|
|

17
ExxonMobil
XOM
$677B
| $3.63M | 1.81% |
22,288
-142
| -0.6% | -$22.2K |
2024 Q4
7 quarters
|
|

18
Enbridge
ENB
$105B
| $3.5M | 1.75% |
75,330
-203
| -0.3% | -$10.5K |
2024 Q4
7 quarters
|
|

19
Invesco QQQ Trust
QQQ
$443B
| $3.38M | 1.69% |
4,572
+31
| +0.7% | +$22.2K |
2024 Q4
7 quarters
|
|

20
RTX Corp
RTX
$256B
| $3.35M | 1.67% |
18,044
-1,055
| -6% | -$216K |
2024 Q4
7 quarters
|
|

21
Invesco S&P 500 Quality ETF
SPHQ
$18.1B
| $2.85M | 1.43% |
33,955
-145
| -0.4% | -$12.4K |
2024 Q4
7 quarters
|
|

22
Norfolk Southern
NSC
$71.9B
| $2.83M | 1.42% |
9,171
-100
| -1% | -$33.1K |
2024 Q4
7 quarters
|
|
|
23
Emerson Electric
EMR
$90.6B
| $2.7M | 1.35% |
17,421
-1,672
| -9% | -$252K |
2024 Q4
7 quarters
|
|
|
24
BlackRock US Equity Factor Rotation ETF
DYNF
$40.3B
| $2.7M | 1.35% |
38,926
+4,335
| +13% | +$298K |
2025 Q2
5 quarters
|
|

25
Berkshire Hathaway Class B
BRK.B
$1.22T
| $2.61M | 1.3% |
5,238
-220
| -4% | -$111K |
2024 Q4
7 quarters
|
|
Similar funds

TDB




Kentucky Trust Company's Q3 2026 Portfolio in Review
As of Q3 2026, Kentucky Trust Company held 320 positions worth $200M, down 3.7% from $208M the previous quarter. Its ten largest holdings account for 33% of the portfolio.
Trading was light in Q3 2026: portfolio turnover was 2.5%. Kentucky Trust Company opened 4 new positions and exited 4, leaving the 320-position portfolio largely intact.
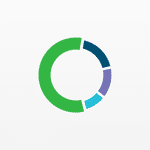
By sector, the portfolio is most concentrated in Technology at 19% of assets, up from 19% a quarter earlier, followed by Financials and Miscellaneous.
- Kentucky Trust Company's largest Q3 2026 buy was Primo Brands: 1,000 shares worth $19K.
- Kentucky Trust Company added most to BlackRock US Equity Factor Rotation ETF in Q3 2026, an estimated $298K increase.
- Kentucky Trust Company's biggest Q3 2026 reduction was Alphabet (Google) Class C, cutting an estimated $472K.
- Kentucky Trust Company fully exited PPL Corp in Q3 2026, selling an estimated $36.4K.
- Kentucky Trust Company's ten largest holdings make up 33% of its $200M portfolio in Q3 2026.
- Kentucky Trust Company opened 4 new positions and closed 4 in Q3 2026.
- Kentucky Trust Company's portfolio value fell 3.7% quarter-over-quarter to $200M.
Based on Kentucky Trust Company's 13F filing for Q3 2026, filed 15 Oct 2026.