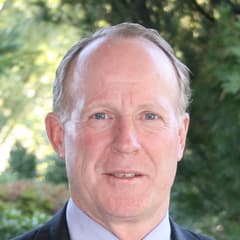
Harry Burn Sound Shore Management
Harry Burn is a co-founder of Sound Shore Management, a firm focused on large-cap value equities selected through fundamental research. Sound Shore is known for a disciplined valuation process and a relatively compact list of portfolio holdings. The firm is often cited among long-standing institutional value managers with a public-markets track record.
Top Buys
| Rank | Stock | Value |
|---|---|---|
| 1 |

Berkshire Hathaway Class B
BRK.B
|
+$144M |
| 2 |

TotalEnergies
TTE
|
+$129M |
| 3 |

Pfizer
PFE
|
+$129M |
| 4 |

Hewlett Packard
HPE
|
+$93.3M |
| 5 |
TWX
Time Warner
TWX
|
+$25.2M |
Top Sells
| Rank | Stock | Value |
|---|---|---|
| 1 |

Sanofi
SNY
|
+$152M |
| 2 |

AIG
AIG
|
+$151M |
| 3 |

EQT
EQT
|
+$52.6M |
| 4 |

Thermo Fisher Scientific
TMO
|
+$51.5M |
| 5 |

Aon
AON
|
+$44.8M |
Sector Composition
| Rank | Sector | Weight |
|---|---|---|
| 1 | Financials | 24.73% |
| 2 | Technology | 22.96% |
| 3 | Communication Services | 16.13% |
| 4 | Healthcare | 11.04% |
| 5 | Energy | 7.45% |
| Name | Market Value | Portfolio Weight | Shares or Principal |
Change in Stake | Capital Flow | Held Since | |
|---|---|---|---|---|---|---|---|

1
Merck
MRK
$327B
| $195M | 3.55% |
3,870,028
+289,053
| +8% | +$14.2M |
2015 Q2
3 quarters
|
|

2
Oracle
ORCL
$345B
| $192M | 3.5% |
4,701,723
-94,611
| -2% | -$3.5M |
2014 Q4
5 quarters
|
|

3
Microsoft
MSFT
$3.7T
| $181M | 3.29% |
3,275,659
-8,613
| -0.3% | -$452K |
2015 Q3
2 quarters
|
|

4
Capital One
COF
$109B
| $170M | 3.09% |
2,447,597
+114,552
| +5% | +$7.57M |
2013 Q2
11 quarters
|
|

5
DELISTED
Paramount Global Class B
PARA
| $167M | 3.03% |
3,027,799
-280,917
| -8% | -$13.7M |
2014 Q4
5 quarters
|
|

6
International Paper
IP
$16.5B
| $167M | 3.03% |
4,285,598
-52,089
| -1% | -$1.81M |
2014 Q2
7 quarters
|
|
|
CIT
7
DELISTED
CIT Group
CIT
| $165M | 3.01% |
5,328,967
+781,832
| +17% | +$24.6M |
2013 Q2
11 quarters
|
|

8
Analog Devices
ADI
$183B
| $162M | 2.94% |
2,734,139
+123,507
| +5% | +$6.59M |
2015 Q3
2 quarters
|
|

9
Flex
FLEX
$27.4B
| $161M | 2.92% |
17,673,898
-60,856
| -0.3% | -$489K |
2013 Q2
11 quarters
|
|
|
10
Berkshire Hathaway Class B
BRK.B
$1.22T
| $154M | 2.8% |
+1,087,020
| New | +$144M |
2016 Q1
0 quarters
|
|

11
Applied Materials
AMAT
$269B
| $154M | 2.8% |
7,262,948
-2,161,622
| -23% | -$39.4M |
2013 Q2
11 quarters
|
|

12
Liberty Global Class C
LBTYK
$3.29B
| $153M | 2.79% |
4,701,463
+641,583
| +16% | +$19.5M |
2015 Q4
1 quarter
|
|

13
Comcast
CMCSA
$88.3B
| $153M | 2.78% |
5,012,260
-737,178
| -13% | -$21.2M |
2013 Q2
11 quarters
|
|

14
Exelon
EXC
$47B
| $153M | 2.78% |
5,970,075
-1,547,389
| -21% | -$34.7M |
2015 Q2
3 quarters
|
|

15
Keysight
KEYS
$47.9B
| $152M | 2.76% |
5,466,709
+235,088
| +4% | +$5.9M |
2014 Q4
5 quarters
|
|
|
TWX
16
DELISTED
Time Warner
TWX
| $150M | 2.73% |
2,071,646
+365,899
| +21% | +$25.2M |
2013 Q2
11 quarters
|
|

17
GE Aerospace
GE
$331B
| $150M | 2.73% |
985,722
-71,429
| -7% | -$10.1M |
2013 Q2
11 quarters
|
|

18
Invesco
IVZ
$12.2B
| $150M | 2.73% |
4,871,433
+193,876
| +4% | +$5.59M |
2013 Q2
11 quarters
|
|

19
Marsh
MRSH
$97.3B
| $149M | 2.7% |
2,443,608
-375,370
| -13% | -$21M |
2013 Q2
11 quarters
|
|

20
Citigroup
C
$191B
| $147M | 2.68% |
3,529,570
+144,125
| +4% | +$6.02M |
2013 Q2
11 quarters
|
|

21
Bank of America
BAC
$335B
| $147M | 2.68% |
10,879,147
+730,708
| +7% | +$9.9M |
2013 Q2
11 quarters
|
|

22
Texas Instruments
TXN
$261B
| $147M | 2.67% |
2,553,185
-10,052
| -0.4% | -$534K |
2013 Q2
11 quarters
|
|

23
Agilent Technologies
A
$49.4B
| $145M | 2.64% |
3,641,415
-367,079
| -9% | -$14M |
2013 Q2
11 quarters
|
|

24
Alphabet (Google) Class A
GOOGL
$3.35T
| $144M | 2.62% |
3,771,900
+25,740
| +0.7% | +$948K |
2015 Q4
1 quarter
|
|
|
25
EQT
EQT
$30.8B
| $142M | 2.59% |
3,882,217
-1,642,673
| -30% | -$52.6M |
2015 Q4
1 quarter
|
|
Similar funds






Harry Burn's Q1 2016 Portfolio in Review
As of Q1 2016, Harry Burn held 40 positions worth $5.5B, up 0.04% from $5.5B the previous quarter. Its ten largest holdings account for 31% of the portfolio.
Harry Burn's Q1 2016 filing shows 3 new, 13 increased, 21 reduced and 2 closed positions. Its largest new stake was Berkshire Hathaway Class B: 1,087,020 shares worth $154M. The largest sale was Sanofi, an estimated $152M.
By sector, the portfolio is most concentrated in Financials at 25% of assets, down from 27% a quarter earlier, followed by Technology and Communication Services.
- Harry Burn's largest Q1 2016 buy was Berkshire Hathaway Class B: 1,087,020 shares worth $154M.
- Harry Burn added most to TotalEnergies in Q1 2016, an estimated $129M increase.
- Harry Burn's biggest Q1 2016 reduction was EQT, cutting an estimated $52.6M.
- Harry Burn fully exited Sanofi in Q1 2016, selling an estimated $152M.
- Harry Burn's ten largest holdings make up 31% of its $5.5B portfolio in Q1 2016.
- Harry Burn opened 3 new positions and closed 2 in Q1 2016.
- Harry Burn's portfolio value rose 0.04% quarter-over-quarter to $5.5B.
Based on Sound Shore Management's 13F filing for Q1 2016, filed 5 May 2016.